Search for Indicators
Disparities Dashboard
View all indicators that include breakout data by topics such as race/ethnicity, age and gender.
According to the CDC "Health disparities are preventable differences in the burden of disease, injury, violence, or opportunities to achieve optimal health that are experienced by socially disadvantaged populations.1 Populations can be defined by factors such as race or ethnicity, gender, education or income, disability, geographic location (e.g., rural or urban), or sexual orientation. Health disparities are inequitable and are directly related to the historical and current unequal distribution of social, political, economic, and environmental resources.
Health disparities result from multiple factors, including
- Poverty
- Environmental threats
- Inadequate access to health care
- Individual and behavioral factors
- Educational inequalities"
Indicator Gauge Icon Legend
Legend Colors
Red is bad, green is good, blue is not statistically different/neutral.
Compared to Distribution
 the value is in the best half of communities.
 the value is in the 2nd worst quarter of communities.
 the value is in the worst quarter of communities.
Compared to Target
 meets target;
  does not meet target.
Compared to a Single Value
 lower than the comparison value;
 higher than the comparison value;
 not statistically different from comparison value.
Trend

 non-significant change over time;
 significant change over time;
  no change over time.
Compared to Prior Value
 higher than the previous measurement period;
 lower than the previous measurement period;
 no statistically different change from previous measurement period.
 Significantly better than the overall value
 Significantly worse than the overall value
 Significantly different than the overall value
 No significant difference with the overall value
 No data on significance available
County: Clackamas
Health / Alcohol & Drug Use
Value
Compared to:
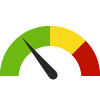
County: Clackamas Age-Adjusted Drug and Opioid-Involved Overdose Death Rate
County: Clackamas Age-Adjusted Drug and Opioid-Involved Overdose Death Rate
11.1
Deaths per 100,000 population
(2018-2020)
Compared to:

U.S. Counties
The distribution is based on data from 1,303 U.S. counties and county equivalents.
OR Value
(15.1)
The regional value is compared to the Oregon State value.
US Value
(23.5)
The regional value is compared to the national value.
Prior Value
(10.3)
Prior Value compares a measured value with the previously measured value. Confidence intervals were taken into account in determining the direction of the comparison.
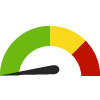
County: Clackamas Death Rate due to Drug Poisoning
County: Clackamas Death Rate due to Drug Poisoning
13.8
Deaths per 100,000 population
(2019-2021)
Compared to:
OR Counties
The distribution is based on data from 27 Oregon counties.
U.S. Counties
The distribution is based on data from 1,899 U.S. counties and county equivalents.
OR Value
(20.4)
The regional value is compared to the Oregon State value.
US Value
(27.2)
The regional value is compared to the national value.
HP 2030 Target
(20.7)
<div>SU-03: Reduce drug overdose deaths <strong>(LEADING HEALTH INDICATOR)</strong></div>
County: Clackamas
Health / Cancer
Value
Compared to:
County: Clackamas Age-Adjusted Death Rate due to Cancer
County: Clackamas Age-Adjusted Death Rate due to Cancer
146.1
Deaths per 100,000 population
(2016-2020)
Compared to:
OR Counties
The distribution is based on data from 36 Oregon counties.
U.S. Counties
The distribution is based on data from 3,085 U.S. counties and county equivalents.
OR Value
(150.6)
The regional value is compared to the Oregon State value.
US Value
(149.4)
The regional value is compared to the national value.
Prior Value
(147.5)
Prior Value compares a measured value with the previously measured value. Confidence intervals were taken into account in determining the direction of the comparison.
Trend
This comparison measures the indicator’s values over multiple time periods.<br>The Mann-Kendall Test for Statistical Significance is used to evaluate the trend<br>over 4 to 10 periods of measure, subject to data availability and comparability.
HP 2030 Target
(122.7)
County: Clackamas Age-Adjusted Death Rate due to Lung Cancer
County: Clackamas Age-Adjusted Death Rate due to Lung Cancer
29.5
Deaths per 100,000 population
(2016-2020)
Compared to:
OR Counties
The distribution is based on data from 32 Oregon counties.
U.S. Counties
The distribution is based on data from 2,752 U.S. counties and county equivalents.
OR Value
(33.2)
The regional value is compared to the Oregon State value.
US Value
(35.0)
The regional value is compared to the national value.
Prior Value
(30.7)
Prior Value compares a measured value with the previously measured value. Confidence intervals were taken into account in determining the direction of the comparison.
Trend
This comparison measures the indicator’s values over multiple time periods.<br>The Mann-Kendall Test for Statistical Significance is used to evaluate the trend<br>over 4 to 10 periods of measure, subject to data availability and comparability.
HP 2030 Target
(25.1)
County: Clackamas All Cancer Incidence Rate
County: Clackamas All Cancer Incidence Rate
443.8
Cases per 100,000 population
(2016-2020)
Compared to:


OR Counties
The distribution is based on data from 36 Oregon counties.
U.S. Counties
The distribution is based on data from 2,693 U.S. counties and county equivalents.
OR Value
(419.2)
The regional value is compared to the Oregon State value.
US Value
(442.3)
The regional value is compared to the national value.
Prior Value
(455.3)
Prior Value compares a measured value with the previously measured value. Confidence intervals were taken into account in determining the direction of the comparison.
Trend
This comparison measures the indicator’s values over multiple time periods.<br>The Mann-Kendall Test for Statistical Significance is used to evaluate the trend<br>over 4 to 10 periods of measure, subject to data availability and comparability.
County: Clackamas Breast Cancer Incidence Rate
County: Clackamas Breast Cancer Incidence Rate
142.5
Cases per 100,000 females
(2016-2020)
Compared to:
OR Counties
The distribution is based on data from 33 Oregon counties.
U.S. Counties
The distribution is based on data from 2,478 U.S. counties and county equivalents.
OR Value
(128.8)
The regional value is compared to the Oregon State value.
US Value
(127.0)
The regional value is compared to the national value.
Prior Value
(141.4)
Prior Value compares a measured value with the previously measured value. Confidence intervals were taken into account in determining the direction of the comparison.
Trend
This comparison measures the indicator’s values over multiple time periods.<br>The Mann-Kendall Test for Statistical Significance is used to evaluate the trend<br>over 4 to 10 periods of measure, subject to data availability and comparability.
County: Clackamas Cancer: Medicare Population
County: Clackamas Cancer: Medicare Population
11.0%
(2022)
Compared to:

OR Counties
The distribution is based on data from 36 Oregon counties.
U.S. Counties
The distribution is based on data from 3,129 U.S. counties and county equivalents.
OR Value
(10.0%)
The regional value is compared to the Oregon State value.
US Value
(12.0%)
The regional value is compared to the national value.
Prior Value
(11.0%)
Prior Value compares a measured value with the previously measured value. Confidence intervals were not taken into account in determining the direction of the comparison.
Trend
This comparison measures the indicator’s values over multiple time periods.<br>The Mann-Kendall Test for Statistical Significance is used to evaluate the trend<br>over 4 to 10 periods of measure, subject to data availability and comparability.
County: Clackamas Colorectal Cancer Incidence Rate
County: Clackamas Colorectal Cancer Incidence Rate
34.6
Cases per 100,000 population
(2016-2020)
Compared to:
OR Counties
The distribution is based on data from 32 Oregon counties.
U.S. Counties
The distribution is based on data from 2,401 U.S. counties and county equivalents.
OR Value
(32.8)
The regional value is compared to the Oregon State value.
US Value
(36.5)
The regional value is compared to the national value.
Prior Value
(34.8)
Prior Value compares a measured value with the previously measured value. Confidence intervals were taken into account in determining the direction of the comparison.
Trend
This comparison measures the indicator’s values over multiple time periods.<br>The Mann-Kendall Test for Statistical Significance is used to evaluate the trend<br>over 4 to 10 periods of measure, subject to data availability and comparability.
County: Clackamas Lung and Bronchus Cancer Incidence Rate
County: Clackamas Lung and Bronchus Cancer Incidence Rate
47.2
Cases per 100,000 population
(2016-2020)
Compared to:
OR Counties
The distribution is based on data from 33 Oregon counties.
U.S. Counties
The distribution is based on data from 2,471 U.S. counties and county equivalents.
OR Value
(49.1)
The regional value is compared to the Oregon State value.
US Value
(54.0)
The regional value is compared to the national value.
Prior Value
(50.7)
Prior Value compares a measured value with the previously measured value. Confidence intervals were taken into account in determining the direction of the comparison.
Trend
This comparison measures the indicator’s values over multiple time periods.<br>The Mann-Kendall Test for Statistical Significance is used to evaluate the trend<br>over 4 to 10 periods of measure, subject to data availability and comparability.
County: Clackamas Mammography Screening: Medicare Population
County: Clackamas Mammography Screening: Medicare Population
45.0%
(2022)
Compared to:


OR Counties
The distribution is based on data from 36 Oregon counties.
U.S. Counties
The distribution is based on data from 3,123 U.S. counties and county equivalents.
OR Value
(45.0%)
The regional value is compared to the Oregon State value.
US Value
(47.0%)
The regional value is compared to the national value.
Prior Value
(46.0%)
Prior Value compares a measured value with the previously measured value. Confidence intervals were not taken into account in determining the direction of the comparison.
Trend
This comparison measures the indicator’s values over multiple time periods.<br>The Mann-Kendall Test for Statistical Significance is used to evaluate the trend<br>over 4 to 10 periods of measure, subject to data availability and comparability.
County: Clackamas Oral Cavity and Pharynx Cancer Incidence Rate
County: Clackamas Oral Cavity and Pharynx Cancer Incidence Rate
11.8
Cases per 100,000 population
(2016-2020)
Compared to:
OR Counties
The distribution is based on data from 26 Oregon counties.
U.S. Counties
The distribution is based on data from 1,706 U.S. counties and county equivalents.
OR Value
(12.2)
The regional value is compared to the Oregon State value.
US Value
(11.9)
The regional value is compared to the national value.
Prior Value
(12.7)
Prior Value compares a measured value with the previously measured value. Confidence intervals were taken into account in determining the direction of the comparison.
Trend
This comparison measures the indicator’s values over multiple time periods.<br>The Mann-Kendall Test for Statistical Significance is used to evaluate the trend<br>over 4 to 10 periods of measure, subject to data availability and comparability.
County: Clackamas Prostate Cancer Incidence Rate
County: Clackamas Prostate Cancer Incidence Rate
97.7
Cases per 100,000 males
(2016-2020)
Compared to:
OR Counties
The distribution is based on data from 33 Oregon counties.
U.S. Counties
The distribution is based on data from 2,500 U.S. counties and county equivalents.
OR Value
(94.4)
The regional value is compared to the Oregon State value.
US Value
(110.5)
The regional value is compared to the national value.
Prior Value
(98.7)
Prior Value compares a measured value with the previously measured value. Confidence intervals were taken into account in determining the direction of the comparison.
Trend
This comparison measures the indicator’s values over multiple time periods.<br>The Mann-Kendall Test for Statistical Significance is used to evaluate the trend<br>over 4 to 10 periods of measure, subject to data availability and comparability.
County: Clackamas
Health / Diabetes
Value
Compared to:
County: Clackamas Age-Adjusted Death Rate due to Diabetes
County: Clackamas Age-Adjusted Death Rate due to Diabetes
19.7
Deaths per 100,000 population
(2018-2020)
Compared to:
OR Counties
The distribution is based on data from 25 Oregon counties.
U.S. Counties
The distribution is based on data from 1,937 U.S. counties and county equivalents.
OR Value
(23.4)
The regional value is compared to the Oregon State value.
US Value
(22.6)
The regional value is compared to the national value.
Prior Value
(20.7)
Prior Value compares a measured value with the previously measured value. Confidence intervals were taken into account in determining the direction of the comparison.
Trend
This comparison measures the indicator’s values over multiple time periods.<br>The Mann-Kendall Test for Statistical Significance is used to evaluate the trend<br>over 4 to 10 periods of measure, subject to data availability and comparability.
County: Clackamas Diabetes: Medicare Population
County: Clackamas Diabetes: Medicare Population
17.0%
(2022)
Compared to:
OR Counties
The distribution is based on data from 36 Oregon counties.
U.S. Counties
The distribution is based on data from 3,129 U.S. counties and county equivalents.
OR Value
(19.0%)
The regional value is compared to the Oregon State value.
US Value
(24.0%)
The regional value is compared to the national value.
Prior Value
(18.0%)
Prior Value compares a measured value with the previously measured value. Confidence intervals were not taken into account in determining the direction of the comparison.
Trend
This comparison measures the indicator’s values over multiple time periods.<br>The Mann-Kendall Test for Statistical Significance is used to evaluate the trend<br>over 4 to 10 periods of measure, subject to data availability and comparability.
County: Clackamas
Health / Disabilities
Value
Compared to:
County: Clackamas Children with a Disability
County: Clackamas Children with a Disability
3.3%
(2018-2022)
Compared to:


OR Value
(5.2%)
The regional value is compared to the Oregon State value.
US Value
(4.5%)
The regional value is compared to the national value.
Trend
This comparison measures the indicator’s values over multiple time periods.<br>The Mann-Kendall Test for Statistical Significance is used to evaluate the trend<br>over 4 to 10 periods of measure, subject to data availability and comparability.
County: Clackamas Persons with a Cognitive Difficulty
County: Clackamas Persons with a Cognitive Difficulty
5.2%
(2018-2022)
Compared to:

OR Value
(6.7%)
The regional value is compared to the Oregon State value.
US Value
(5.3%)
The regional value is compared to the national value.
Trend
This comparison measures the indicator’s values over multiple time periods.<br>The Mann-Kendall Test for Statistical Significance is used to evaluate the trend<br>over 4 to 10 periods of measure, subject to data availability and comparability.
County: Clackamas Persons with a Disability
County: Clackamas Persons with a Disability
12.6%
(2018-2022)
Compared to:
OR Value
(14.9%)
The regional value is compared to the Oregon State value.
US Value
(12.9%)
The regional value is compared to the national value.
Trend
This comparison measures the indicator’s values over multiple time periods.<br>The Mann-Kendall Test for Statistical Significance is used to evaluate the trend<br>over 4 to 10 periods of measure, subject to data availability and comparability.
County: Clackamas Persons with a Hearing Difficulty
County: Clackamas Persons with a Hearing Difficulty
4.4%
(2018-2022)
Compared to:

OR Value
(4.6%)
The regional value is compared to the Oregon State value.
US Value
(3.6%)
The regional value is compared to the national value.
Trend
This comparison measures the indicator’s values over multiple time periods.<br>The Mann-Kendall Test for Statistical Significance is used to evaluate the trend<br>over 4 to 10 periods of measure, subject to data availability and comparability.
County: Clackamas Persons with a Self-Care Difficulty
County: Clackamas Persons with a Self-Care Difficulty
2.5%
(2018-2022)
Compared to:
OR Value
(2.8%)
The regional value is compared to the Oregon State value.
US Value
(2.6%)
The regional value is compared to the national value.
Trend
This comparison measures the indicator’s values over multiple time periods.<br>The Mann-Kendall Test for Statistical Significance is used to evaluate the trend<br>over 4 to 10 periods of measure, subject to data availability and comparability.
County: Clackamas Persons with a Vision Difficulty
County: Clackamas Persons with a Vision Difficulty
2.1%
(2018-2022)
Compared to:

OR Value
(2.4%)
The regional value is compared to the Oregon State value.
US Value
(2.4%)
The regional value is compared to the national value.
Trend
This comparison measures the indicator’s values over multiple time periods.<br>The Mann-Kendall Test for Statistical Significance is used to evaluate the trend<br>over 4 to 10 periods of measure, subject to data availability and comparability.
County: Clackamas Persons with an Ambulatory Difficulty
County: Clackamas Persons with an Ambulatory Difficulty
6.0%
(2018-2022)
Compared to:

OR Value
(7.1%)
The regional value is compared to the Oregon State value.
US Value
(6.7%)
The regional value is compared to the national value.
Trend
This comparison measures the indicator’s values over multiple time periods.<br>The Mann-Kendall Test for Statistical Significance is used to evaluate the trend<br>over 4 to 10 periods of measure, subject to data availability and comparability.
County: Clackamas
Health / Health Care Access & Quality
Value
Compared to:
County: Clackamas Community Spending on Health Care
County: Clackamas Community Spending on Health Care
7.8%
(2023)
Compared to:

OR Value
(7.9%)
The regional value is compared to the Oregon State value.
US Value
(8.0%)
The regional value is compared to the national value.
Prior Value
(7.9%)
Prior Value compares a measured value with the previously measured value. Confidence intervals were not taken into account in determining the direction of the comparison.
County: Clackamas Health Insurance Spending-to-Income Ratio
County: Clackamas Health Insurance Spending-to-Income Ratio
5.6%
(2023)
Compared to:
OR Counties
The distribution is based on data from 36 Oregon counties.
U.S. Counties
The distribution is based on data from 3,141 U.S. counties and county equivalents.
OR Value
(6.0%)
The regional value is compared to the Oregon State value.
Prior Value
(5.6%)
Prior Value compares a measured value with the previously measured value. Confidence intervals were not taken into account in determining the direction of the comparison.
County: Clackamas Persons with Health Insurance
County: Clackamas Persons with Health Insurance
94.3%
(2021)
Compared to:
OR Counties
The distribution is based on data from 36 Oregon counties.
U.S. Counties
The distribution is based on data from 3,140 U.S. counties and county equivalents.
OR Value
(92.6%)
The regional value is compared to the Oregon State value.
Prior Value
(93.8%)
Prior Value compares a measured value with the previously measured value. Confidence intervals were taken into account in determining the direction of the comparison.
Trend
This comparison measures the indicator’s values over multiple time periods.<br>The Mann-Kendall Test for Statistical Significance is used to evaluate the trend<br>over 4 to 10 periods of measure, subject to data availability and comparability.
HP 2030 Target
(92.4%)
<div>AHS-01: Increase the proportion of people with health insurance <strong>(LEADING HEALTH INDICATOR)</strong></div>
County: Clackamas Persons with Private Health Insurance Only
County: Clackamas Persons with Private Health Insurance Only
60.1%
(2022)
Compared to:
OR Value
(52.8%)
The regional value is compared to the Oregon State value.
US Value
(54.8%)
The regional value is compared to the national value.
Prior Value
(60.9%)
Prior Value compares a measured value with the previously measured value. Confidence intervals were not taken into account in determining the direction of the comparison.
Trend
This comparison measures the indicator’s values over multiple time periods.<br>The Mann-Kendall Test for Statistical Significance is used to evaluate the trend<br>over 4 to 10 periods of measure, subject to data availability and comparability.
County: Clackamas Persons with Public Health Insurance Only
County: Clackamas Persons with Public Health Insurance Only
21.1%
(2022)
Compared to:

OR Value
(26.9%)
The regional value is compared to the Oregon State value.
US Value
(24.8%)
The regional value is compared to the national value.
Prior Value
(20.9%)
Prior Value compares a measured value with the previously measured value. Confidence intervals were not taken into account in determining the direction of the comparison.
Trend
This comparison measures the indicator’s values over multiple time periods.<br>The Mann-Kendall Test for Statistical Significance is used to evaluate the trend<br>over 4 to 10 periods of measure, subject to data availability and comparability.
County: Clackamas Preventable Hospital Stays: Medicare Population
County: Clackamas Preventable Hospital Stays: Medicare Population
1,787.0
Discharges per 100,000 Medicare enrollees
(2022)
Compared to:

OR Counties
The distribution is based on data from 36 Oregon counties.
U.S. Counties
The distribution is based on data from 3,129 U.S. counties and county equivalents.
OR Value
(1,812.0)
The regional value is compared to the Oregon State value.
US Value
(2,677.0)
The regional value is compared to the national value.
Prior Value
(1,768.0)
Prior Value compares a measured value with the previously measured value. Confidence intervals were not taken into account in determining the direction of the comparison.
Trend
This comparison measures the indicator’s values over multiple time periods.<br>The Mann-Kendall Test for Statistical Significance is used to evaluate the trend<br>over 4 to 10 periods of measure, subject to data availability and comparability.
County: Clackamas
Health / Health Information Technology
Value
Compared to:
County: Clackamas Persons with an Internet Subscription
County: Clackamas Persons with an Internet Subscription
93.9%
(2018-2022)
Compared to:
OR Counties
The distribution is based on data from 36 Oregon counties.
U.S. Counties
The distribution is based on data from 3,133 U.S. counties and county equivalents.
OR Value
(93.0%)
The regional value is compared to the Oregon State value.
US Value
(91.0%)
The regional value is compared to the national value.
Trend
This comparison measures the indicator’s values over multiple time periods.<br>The Mann-Kendall Test for Statistical Significance is used to evaluate the trend<br>over 4 to 10 periods of measure, subject to data availability and comparability.
County: Clackamas
Health / Heart Disease & Stroke
Value
Compared to:
County: Clackamas Age-Adjusted Death Rate due to Cerebrovascular Disease (Stroke)
County: Clackamas Age-Adjusted Death Rate due to Cerebrovascular Disease (Stroke)
41.2
Deaths per 100,000 population
(2018-2020)
Compared to:
OR Counties
The distribution is based on data from 30 Oregon counties.
U.S. Counties
The distribution is based on data from 2,338 U.S. counties and county equivalents.
OR Value
(39.3)
The regional value is compared to the Oregon State value.
US Value
(37.6)
The regional value is compared to the national value.
Prior Value
(39.1)
Prior Value compares a measured value with the previously measured value. Confidence intervals were taken into account in determining the direction of the comparison.
Trend
This comparison measures the indicator’s values over multiple time periods.<br>The Mann-Kendall Test for Statistical Significance is used to evaluate the trend<br>over 4 to 10 periods of measure, subject to data availability and comparability.
HP 2030 Target
(33.4)
County: Clackamas Age-Adjusted Death Rate due to Heart Attack
County: Clackamas Age-Adjusted Death Rate due to Heart Attack
28.2
Deaths per 100,000 population 35+ years
(2020)
Compared to:
OR Counties
The distribution is based on data from 22 Oregon counties.
OR Value
(35.5)
The regional value is compared to the Oregon State value.
Prior Value
(31.6)
Prior Value compares a measured value with the previously measured value. Confidence intervals were not taken into account in determining the direction of the comparison.
Trend
This comparison measures the indicator’s values over multiple time periods.<br>The Mann-Kendall Test for Statistical Significance is used to evaluate the trend<br>over 4 to 10 periods of measure, subject to data availability and comparability.
County: Clackamas Age-Adjusted Hospitalization Rate due to Heart Attack
County: Clackamas Age-Adjusted Hospitalization Rate due to Heart Attack
21.8
Hospitalizations per 10,000 population 35+ years
(2021)
Compared to:
OR Counties
The distribution is based on data from 29 Oregon counties.
OR Value
(20.9 in 2020)
The regional value is compared to the Oregon State value.
Prior Value
(20.9)
Prior Value compares a measured value with the previously measured value. Confidence intervals were not taken into account in determining the direction of the comparison.
Trend
This comparison measures the indicator’s values over multiple time periods.<br>The Mann-Kendall Test for Statistical Significance is used to evaluate the trend<br>over 4 to 10 periods of measure, subject to data availability and comparability.
County: Clackamas Atrial Fibrillation: Medicare Population
County: Clackamas Atrial Fibrillation: Medicare Population
14.0%
(2022)
Compared to:
OR Counties
The distribution is based on data from 36 Oregon counties.
U.S. Counties
The distribution is based on data from 3,129 U.S. counties and county equivalents.
OR Value
(13.0%)
The regional value is compared to the Oregon State value.
US Value
(14.0%)
The regional value is compared to the national value.
Prior Value
(13.0%)
Prior Value compares a measured value with the previously measured value. Confidence intervals were not taken into account in determining the direction of the comparison.
Trend
This comparison measures the indicator’s values over multiple time periods.<br>The Mann-Kendall Test for Statistical Significance is used to evaluate the trend<br>over 4 to 10 periods of measure, subject to data availability and comparability.
County: Clackamas Heart Failure: Medicare Population
County: Clackamas Heart Failure: Medicare Population
10.0%
(2022)
Compared to:
OR Counties
The distribution is based on data from 36 Oregon counties.
U.S. Counties
The distribution is based on data from 3,129 U.S. counties and county equivalents.
OR Value
(10.0%)
The regional value is compared to the Oregon State value.
US Value
(11.0%)
The regional value is compared to the national value.
Prior Value
(10.0%)
Prior Value compares a measured value with the previously measured value. Confidence intervals were not taken into account in determining the direction of the comparison.
Trend
This comparison measures the indicator’s values over multiple time periods.<br>The Mann-Kendall Test for Statistical Significance is used to evaluate the trend<br>over 4 to 10 periods of measure, subject to data availability and comparability.
County: Clackamas Hyperlipidemia: Medicare Population
County: Clackamas Hyperlipidemia: Medicare Population
52.0%
(2022)
Compared to:
OR Counties
The distribution is based on data from 36 Oregon counties.
U.S. Counties
The distribution is based on data from 3,129 U.S. counties and county equivalents.
OR Value
(53.0%)
The regional value is compared to the Oregon State value.
US Value
(65.0%)
The regional value is compared to the national value.
Prior Value
(50.0%)
Prior Value compares a measured value with the previously measured value. Confidence intervals were not taken into account in determining the direction of the comparison.
Trend
This comparison measures the indicator’s values over multiple time periods.<br>The Mann-Kendall Test for Statistical Significance is used to evaluate the trend<br>over 4 to 10 periods of measure, subject to data availability and comparability.
County: Clackamas Hypertension: Medicare Population
County: Clackamas Hypertension: Medicare Population
54.0%
(2022)
Compared to:
OR Counties
The distribution is based on data from 36 Oregon counties.
U.S. Counties
The distribution is based on data from 3,129 U.S. counties and county equivalents.
OR Value
(56.0%)
The regional value is compared to the Oregon State value.
US Value
(65.0%)
The regional value is compared to the national value.
Prior Value
(54.0%)
Prior Value compares a measured value with the previously measured value. Confidence intervals were not taken into account in determining the direction of the comparison.
Trend
This comparison measures the indicator’s values over multiple time periods.<br>The Mann-Kendall Test for Statistical Significance is used to evaluate the trend<br>over 4 to 10 periods of measure, subject to data availability and comparability.
County: Clackamas Ischemic Heart Disease: Medicare Population
County: Clackamas Ischemic Heart Disease: Medicare Population
14.0%
(2022)
Compared to:
OR Counties
The distribution is based on data from 36 Oregon counties.
U.S. Counties
The distribution is based on data from 3,129 U.S. counties and county equivalents.
OR Value
(15.0%)
The regional value is compared to the Oregon State value.
US Value
(21.0%)
The regional value is compared to the national value.
Prior Value
(14.0%)
Prior Value compares a measured value with the previously measured value. Confidence intervals were not taken into account in determining the direction of the comparison.
Trend
This comparison measures the indicator’s values over multiple time periods.<br>The Mann-Kendall Test for Statistical Significance is used to evaluate the trend<br>over 4 to 10 periods of measure, subject to data availability and comparability.
County: Clackamas Stroke: Medicare Population
County: Clackamas Stroke: Medicare Population
4.0%
(2022)
Compared to:

OR Counties
The distribution is based on data from 36 Oregon counties.
U.S. Counties
The distribution is based on data from 3,129 U.S. counties and county equivalents.
OR Value
(4.0%)
The regional value is compared to the Oregon State value.
US Value
(6.0%)
The regional value is compared to the national value.
Prior Value
(5.0%)
Prior Value compares a measured value with the previously measured value. Confidence intervals were not taken into account in determining the direction of the comparison.
Trend
This comparison measures the indicator’s values over multiple time periods.<br>The Mann-Kendall Test for Statistical Significance is used to evaluate the trend<br>over 4 to 10 periods of measure, subject to data availability and comparability.
County: Clackamas
Health / Immunizations & Infectious Diseases
Value
Compared to:
County: Clackamas Age-Adjusted Death Rate due to Influenza and Pneumonia
County: Clackamas Age-Adjusted Death Rate due to Influenza and Pneumonia
6.4
Deaths per 100,000 population
(2018-2020)
Compared to:
U.S. Counties
The distribution is based on data from 1,449 U.S. counties and county equivalents.
OR Value
(8.7)
The regional value is compared to the Oregon State value.
US Value
(13.4)
The regional value is compared to the national value.
Prior Value
(8.8)
Prior Value compares a measured value with the previously measured value. Confidence intervals were taken into account in determining the direction of the comparison.
Trend
This comparison measures the indicator’s values over multiple time periods.<br>The Mann-Kendall Test for Statistical Significance is used to evaluate the trend<br>over 4 to 10 periods of measure, subject to data availability and comparability.
County: Clackamas Flu Vaccinations: Medicare Population
County: Clackamas Flu Vaccinations: Medicare Population
50.0%
(2022)
Compared to:
OR Counties
The distribution is based on data from 36 Oregon counties.
U.S. Counties
The distribution is based on data from 3,129 U.S. counties and county equivalents.
OR Value
(44.0%)
The regional value is compared to the Oregon State value.
US Value
(50.0%)
The regional value is compared to the national value.
Prior Value
(48.0%)
Prior Value compares a measured value with the previously measured value. Confidence intervals were not taken into account in determining the direction of the comparison.
Trend
This comparison measures the indicator’s values over multiple time periods.<br>The Mann-Kendall Test for Statistical Significance is used to evaluate the trend<br>over 4 to 10 periods of measure, subject to data availability and comparability.
County: Clackamas Persons Fully Vaccinated Against COVID-19
County: Clackamas Persons Fully Vaccinated Against COVID-19
71.9%
(May 10, 2023)
Compared to:
OR Counties
The distribution is based on data from 36 Oregon counties.
U.S. Counties
The distribution is based on data from 3,125 U.S. counties and county equivalents.
Prior Value
(71.9%)
Prior Value compares a measured value with the previously measured value. Confidence intervals were not taken into account in determining the direction of the comparison.
Trend
This comparison measures the indicator’s values over multiple time periods.<br>The Mann-Kendall Test for Statistical Significance is used to evaluate the trend<br>over 4 to 10 periods of measure, subject to data availability and comparability.
County: Clackamas Pneumonia Vaccinations: Medicare Population
County: Clackamas Pneumonia Vaccinations: Medicare Population
6.0%
(2022)
Compared to:

OR Counties
The distribution is based on data from 36 Oregon counties.
U.S. Counties
The distribution is based on data from 3,129 U.S. counties and county equivalents.
OR Value
(6.0%)
The regional value is compared to the Oregon State value.
US Value
(8.0%)
The regional value is compared to the national value.
Prior Value
(5.0%)
Prior Value compares a measured value with the previously measured value. Confidence intervals were not taken into account in determining the direction of the comparison.
Trend
This comparison measures the indicator’s values over multiple time periods.<br>The Mann-Kendall Test for Statistical Significance is used to evaluate the trend<br>over 4 to 10 periods of measure, subject to data availability and comparability.
County: Clackamas
Health / Mental Health & Mental Disorders
Value
Compared to:
County: Clackamas Age-Adjusted Death Rate due to Suicide
County: Clackamas Age-Adjusted Death Rate due to Suicide
16.4
Deaths per 100,000 population
(2018-2020)
Compared to:
OR Counties
The distribution is based on data from 23 Oregon counties.
U.S. Counties
The distribution is based on data from 1,307 U.S. counties and county equivalents.
OR Value
(19.2)
The regional value is compared to the Oregon State value.
US Value
(13.9)
The regional value is compared to the national value.
Prior Value
(15.9)
Prior Value compares a measured value with the previously measured value. Confidence intervals were taken into account in determining the direction of the comparison.
Trend
This comparison measures the indicator’s values over multiple time periods.<br>The Mann-Kendall Test for Statistical Significance is used to evaluate the trend<br>over 4 to 10 periods of measure, subject to data availability and comparability.
HP 2030 Target
(12.8)
<div>MHMD-01: Reduce the suicide rate <strong>(LEADING HEALTH INDICATOR)</strong></div>
County: Clackamas Depression: Medicare Population
County: Clackamas Depression: Medicare Population
17.0%
(2022)
Compared to:
OR Counties
The distribution is based on data from 36 Oregon counties.
U.S. Counties
The distribution is based on data from 3,129 U.S. counties and county equivalents.
OR Value
(16.0%)
The regional value is compared to the Oregon State value.
US Value
(16.0%)
The regional value is compared to the national value.
Prior Value
(17.0%)
Prior Value compares a measured value with the previously measured value. Confidence intervals were not taken into account in determining the direction of the comparison.
Trend
This comparison measures the indicator’s values over multiple time periods.<br>The Mann-Kendall Test for Statistical Significance is used to evaluate the trend<br>over 4 to 10 periods of measure, subject to data availability and comparability.
County: Clackamas
Health / Mortality Data
Value
Compared to:
County: Clackamas Life Expectancy
County: Clackamas Life Expectancy
80.2
Years
(2019-2021)
Compared to:
OR Counties
The distribution is based on data from 35 Oregon counties.
U.S. Counties
The distribution is based on data from 3,070 U.S. counties and county equivalents.
OR Value
(78.7)
The regional value is compared to the Oregon State value.
US Value
(77.6)
The regional value is compared to the national value.
County: Clackamas
Health / Older Adults
Value
Compared to:
County: Clackamas Adult Day Care Spending-to-Income Ratio
County: Clackamas Adult Day Care Spending-to-Income Ratio
10.3%
(2023)
Compared to:
OR Counties
The distribution is based on data from 36 Oregon counties.
U.S. Counties
The distribution is based on data from 3,141 U.S. counties and county equivalents.
OR Value
(11.3%)
The regional value is compared to the Oregon State value.
Prior Value
(10.4%)
Prior Value compares a measured value with the previously measured value. Confidence intervals were not taken into account in determining the direction of the comparison.
County: Clackamas Adults 65+ with a Disability
County: Clackamas Adults 65+ with a Disability
31.2%
(2018-2022)
Compared to:
OR Value
(34.4%)
The regional value is compared to the Oregon State value.
US Value
(33.3%)
The regional value is compared to the national value.
Trend
This comparison measures the indicator’s values over multiple time periods.<br>The Mann-Kendall Test for Statistical Significance is used to evaluate the trend<br>over 4 to 10 periods of measure, subject to data availability and comparability.
County: Clackamas Adults 65+ with a Hearing Difficulty
County: Clackamas Adults 65+ with a Hearing Difficulty
15.4%
(2018-2022)
Compared to:
OR Value
(16.2%)
The regional value is compared to the Oregon State value.
US Value
(13.7%)
The regional value is compared to the national value.
Trend
This comparison measures the indicator’s values over multiple time periods.<br>The Mann-Kendall Test for Statistical Significance is used to evaluate the trend<br>over 4 to 10 periods of measure, subject to data availability and comparability.
County: Clackamas Adults 65+ with a Self-Care Difficulty
County: Clackamas Adults 65+ with a Self-Care Difficulty
6.7%
(2018-2022)
Compared to:
OR Value
(7.4%)
The regional value is compared to the Oregon State value.
US Value
(7.4%)
The regional value is compared to the national value.
Trend
This comparison measures the indicator’s values over multiple time periods.<br>The Mann-Kendall Test for Statistical Significance is used to evaluate the trend<br>over 4 to 10 periods of measure, subject to data availability and comparability.
County: Clackamas Adults 65+ with a Vision Difficulty
County: Clackamas Adults 65+ with a Vision Difficulty
5.1%
(2018-2022)
Compared to:
OR Value
(5.8%)
The regional value is compared to the Oregon State value.
US Value
(6.0%)
The regional value is compared to the national value.
Trend
This comparison measures the indicator’s values over multiple time periods.<br>The Mann-Kendall Test for Statistical Significance is used to evaluate the trend<br>over 4 to 10 periods of measure, subject to data availability and comparability.
County: Clackamas Adults 65+ with an Independent Living Difficulty
County: Clackamas Adults 65+ with an Independent Living Difficulty
12.4%
(2018-2022)
Compared to:
OR Value
(13.0%)
The regional value is compared to the Oregon State value.
US Value
(13.6%)
The regional value is compared to the national value.
Trend
This comparison measures the indicator’s values over multiple time periods.<br>The Mann-Kendall Test for Statistical Significance is used to evaluate the trend<br>over 4 to 10 periods of measure, subject to data availability and comparability.
County: Clackamas Age-Adjusted Death Rate due to Alzheimer's Disease
County: Clackamas Age-Adjusted Death Rate due to Alzheimer's Disease
36.9
Deaths per 100,000 population
(2018-2020)
Compared to:
OR Counties
The distribution is based on data from 27 Oregon counties.
U.S. Counties
The distribution is based on data from 2,140 U.S. counties and county equivalents.
OR Value
(36.6)
The regional value is compared to the Oregon State value.
US Value
(31.0)
The regional value is compared to the national value.
Prior Value
(35.7)
Prior Value compares a measured value with the previously measured value. Confidence intervals were taken into account in determining the direction of the comparison.
Trend
This comparison measures the indicator’s values over multiple time periods.<br>The Mann-Kendall Test for Statistical Significance is used to evaluate the trend<br>over 4 to 10 periods of measure, subject to data availability and comparability.
County: Clackamas Alzheimer's Disease or Dementia: Medicare Population
County: Clackamas Alzheimer's Disease or Dementia: Medicare Population
6.0%
(2022)
Compared to:
OR Counties
The distribution is based on data from 36 Oregon counties.
U.S. Counties
The distribution is based on data from 3,129 U.S. counties and county equivalents.
OR Value
(5.0%)
The regional value is compared to the Oregon State value.
US Value
(6.0%)
The regional value is compared to the national value.
Prior Value
(6.0%)
Prior Value compares a measured value with the previously measured value. Confidence intervals were not taken into account in determining the direction of the comparison.
Trend
This comparison measures the indicator’s values over multiple time periods.<br>The Mann-Kendall Test for Statistical Significance is used to evaluate the trend<br>over 4 to 10 periods of measure, subject to data availability and comparability.
County: Clackamas
Health / Other Conditions
Value
Compared to:
County: Clackamas Age-Adjusted Death Rate due to Kidney Disease
County: Clackamas Age-Adjusted Death Rate due to Kidney Disease
6.2
Deaths per 100,000 population
(2018-2020)
Compared to:
U.S. Counties
The distribution is based on data from 1,416 U.S. counties and county equivalents.
OR Value
(7.4)
The regional value is compared to the Oregon State value.
US Value
(12.8)
The regional value is compared to the national value.
Prior Value
(6.6)
Prior Value compares a measured value with the previously measured value. Confidence intervals were taken into account in determining the direction of the comparison.
Trend
This comparison measures the indicator’s values over multiple time periods.<br>The Mann-Kendall Test for Statistical Significance is used to evaluate the trend<br>over 4 to 10 periods of measure, subject to data availability and comparability.
County: Clackamas Chronic Kidney Disease: Medicare Population
County: Clackamas Chronic Kidney Disease: Medicare Population
14.0%
(2022)
Compared to:
OR Counties
The distribution is based on data from 36 Oregon counties.
U.S. Counties
The distribution is based on data from 3,129 U.S. counties and county equivalents.
OR Value
(14.0%)
The regional value is compared to the Oregon State value.
US Value
(18.0%)
The regional value is compared to the national value.
Prior Value
(14.0%)
Prior Value compares a measured value with the previously measured value. Confidence intervals were not taken into account in determining the direction of the comparison.
Trend
This comparison measures the indicator’s values over multiple time periods.<br>The Mann-Kendall Test for Statistical Significance is used to evaluate the trend<br>over 4 to 10 periods of measure, subject to data availability and comparability.
County: Clackamas Osteoporosis: Medicare Population
County: Clackamas Osteoporosis: Medicare Population
11.0%
(2022)
Compared to:
OR Counties
The distribution is based on data from 36 Oregon counties.
U.S. Counties
The distribution is based on data from 3,129 U.S. counties and county equivalents.
OR Value
(10.0%)
The regional value is compared to the Oregon State value.
US Value
(11.0%)
The regional value is compared to the national value.
Prior Value
(10.0%)
Prior Value compares a measured value with the previously measured value. Confidence intervals were not taken into account in determining the direction of the comparison.
Trend
This comparison measures the indicator’s values over multiple time periods.<br>The Mann-Kendall Test for Statistical Significance is used to evaluate the trend<br>over 4 to 10 periods of measure, subject to data availability and comparability.
County: Clackamas Rheumatoid Arthritis or Osteoarthritis: Medicare Population
County: Clackamas Rheumatoid Arthritis or Osteoarthritis: Medicare Population
29.0%
(2022)
Compared to:
OR Counties
The distribution is based on data from 36 Oregon counties.
U.S. Counties
The distribution is based on data from 3,129 U.S. counties and county equivalents.
OR Value
(31.0%)
The regional value is compared to the Oregon State value.
US Value
(35.0%)
The regional value is compared to the national value.
Prior Value
(28.0%)
Prior Value compares a measured value with the previously measured value. Confidence intervals were not taken into account in determining the direction of the comparison.
Trend
This comparison measures the indicator’s values over multiple time periods.<br>The Mann-Kendall Test for Statistical Significance is used to evaluate the trend<br>over 4 to 10 periods of measure, subject to data availability and comparability.
County: Clackamas
Health / Physical Activity
Value
Compared to:
County: Clackamas Adults 20+ who are Sedentary
County: Clackamas Adults 20+ who are Sedentary
15.7%
(2021)
Compared to:
OR Counties
The distribution is based on data from 36 Oregon counties.
U.S. Counties
The distribution is based on data from 3,074 U.S. counties and county equivalents.
Prior Value
(14.8%)
Prior Value compares a measured value with the previously measured value. Confidence intervals were taken into account in determining the direction of the comparison.
Trend
This comparison measures the indicator’s values over multiple time periods.<br>The Mann-Kendall Test for Statistical Significance is used to evaluate the trend<br>over 4 to 10 periods of measure, subject to data availability and comparability.
County: Clackamas
Health / Prevention & Safety
Value
Compared to:
County: Clackamas Age-Adjusted Death Rate due to Falls
County: Clackamas Age-Adjusted Death Rate due to Falls
12.2
Deaths per 100,000 population
(2018-2020)
Compared to:
OR Counties
(2017-2019)
The distribution is based on data from 20 Oregon counties.
U.S. Counties
The distribution is based on data from 988 U.S. counties and county equivalents.
OR Value
(14.5)
The regional value is compared to the Oregon State value.
US Value
(9.8)
The regional value is compared to the national value.
Prior Value
(12.4)
Prior Value compares a measured value with the previously measured value. Confidence intervals were taken into account in determining the direction of the comparison.
Trend
This comparison measures the indicator’s values over multiple time periods.<br>The Mann-Kendall Test for Statistical Significance is used to evaluate the trend<br>over 4 to 10 periods of measure, subject to data availability and comparability.
County: Clackamas Age-Adjusted Death Rate due to Firearms
County: Clackamas Age-Adjusted Death Rate due to Firearms
10.4
Deaths per 100,000 population
(2018-2020)
Compared to:
U.S. Counties
The distribution is based on data from 1,083 U.S. counties and county equivalents.
OR Value
(11.8)
The regional value is compared to the Oregon State value.
US Value
(12.0)
The regional value is compared to the national value.
Prior Value
(9.1)
Prior Value compares a measured value with the previously measured value. Confidence intervals were taken into account in determining the direction of the comparison.
Trend
This comparison measures the indicator’s values over multiple time periods.<br>The Mann-Kendall Test for Statistical Significance is used to evaluate the trend<br>over 4 to 10 periods of measure, subject to data availability and comparability.
HP 2030 Target
(10.7)
County: Clackamas Age-Adjusted Death Rate due to Unintentional Injuries
County: Clackamas Age-Adjusted Death Rate due to Unintentional Injuries
38.5
Deaths per 100,000 population
(2018-2020)
Compared to:
OR Counties
The distribution is based on data from 31 Oregon counties.
U.S. Counties
The distribution is based on data from 2,454 U.S. counties and county equivalents.
OR Value
(47.2)
The regional value is compared to the Oregon State value.
US Value
(51.6)
The regional value is compared to the national value.
Prior Value
(36.0)
Prior Value compares a measured value with the previously measured value. Confidence intervals were taken into account in determining the direction of the comparison.
Trend
This comparison measures the indicator’s values over multiple time periods.<br>The Mann-Kendall Test for Statistical Significance is used to evaluate the trend<br>over 4 to 10 periods of measure, subject to data availability and comparability.
HP 2030 Target
(43.2)
County: Clackamas Age-Adjusted Death Rate due to Unintentional Poisonings
County: Clackamas Age-Adjusted Death Rate due to Unintentional Poisonings
11.1
Deaths per 100,000 population
(2018-2020)
Compared to:
U.S. Counties
The distribution is based on data from 1,306 U.S. counties and county equivalents.
OR Value
(15.1)
The regional value is compared to the Oregon State value.
US Value
(23.5)
The regional value is compared to the national value.
Prior Value
(8.8)
Prior Value compares a measured value with the previously measured value. Confidence intervals were taken into account in determining the direction of the comparison.
Trend
This comparison measures the indicator’s values over multiple time periods.<br>The Mann-Kendall Test for Statistical Significance is used to evaluate the trend<br>over 4 to 10 periods of measure, subject to data availability and comparability.
County: Clackamas
Health / Respiratory Diseases
Value
Compared to:
County: Clackamas Age-Adjusted Death Rate due to Chronic Lower Respiratory Diseases
County: Clackamas Age-Adjusted Death Rate due to Chronic Lower Respiratory Diseases
29.1
Deaths per 100,000 population
(2018-2020)
Compared to:
OR Counties
The distribution is based on data from 29 Oregon counties.
U.S. Counties
The distribution is based on data from 2,518 U.S. counties and county equivalents.
OR Value
(36.0)
The regional value is compared to the Oregon State value.
US Value
(38.1)
The regional value is compared to the national value.
Prior Value
(31.0)
Prior Value compares a measured value with the previously measured value. Confidence intervals were taken into account in determining the direction of the comparison.
Trend
This comparison measures the indicator’s values over multiple time periods.<br>The Mann-Kendall Test for Statistical Significance is used to evaluate the trend<br>over 4 to 10 periods of measure, subject to data availability and comparability.
County: Clackamas Asthma: Medicare Population
County: Clackamas Asthma: Medicare Population
6.0%
(2022)
Compared to:
OR Counties
The distribution is based on data from 36 Oregon counties.
U.S. Counties
The distribution is based on data from 3,129 U.S. counties and county equivalents.
OR Value
(6.0%)
The regional value is compared to the Oregon State value.
US Value
(7.0%)
The regional value is compared to the national value.
Prior Value
(6.0%)
Prior Value compares a measured value with the previously measured value. Confidence intervals were not taken into account in determining the direction of the comparison.
Trend
This comparison measures the indicator’s values over multiple time periods.<br>The Mann-Kendall Test for Statistical Significance is used to evaluate the trend<br>over 4 to 10 periods of measure, subject to data availability and comparability.
County: Clackamas COPD: Medicare Population
County: Clackamas COPD: Medicare Population
7.0%
(2022)
Compared to:
OR Counties
The distribution is based on data from 36 Oregon counties.
U.S. Counties
The distribution is based on data from 3,129 U.S. counties and county equivalents.
OR Value
(9.0%)
The regional value is compared to the Oregon State value.
US Value
(11.0%)
The regional value is compared to the national value.
Prior Value
(7.0%)
Prior Value compares a measured value with the previously measured value. Confidence intervals were not taken into account in determining the direction of the comparison.
Trend
This comparison measures the indicator’s values over multiple time periods.<br>The Mann-Kendall Test for Statistical Significance is used to evaluate the trend<br>over 4 to 10 periods of measure, subject to data availability and comparability.
County: Clackamas
Health / Sexually Transmitted Infections
Value
Compared to:
County: Clackamas Chlamydia Incidence Rate
County: Clackamas Chlamydia Incidence Rate
271.2
Cases per 100,000 population
(2021)
Compared to:
OR Counties
The distribution is based on data from 36 Oregon counties.
U.S. Counties
The distribution is based on data from 2,800 U.S. counties and county equivalents.
OR Value
(367.3)
The regional value is compared to the Oregon State value.
US Value
(495.5)
The regional value is compared to the national value.
Prior Value
(270.7)
Prior Value compares a measured value with the previously measured value. Confidence intervals were not taken into account in determining the direction of the comparison.
Trend
This comparison measures the indicator’s values over multiple time periods.<br>The Mann-Kendall Test for Statistical Significance is used to evaluate the trend<br>over 4 to 10 periods of measure, subject to data availability and comparability.
County: Clackamas Gonorrhea Incidence Rate
County: Clackamas Gonorrhea Incidence Rate
86.1
Cases per 100,000 population
(2021)
Compared to:
OR Counties
The distribution is based on data from 36 Oregon counties.
U.S. Counties
The distribution is based on data from 3,117 U.S. counties and county equivalents.
OR Value
(146.5)
The regional value is compared to the Oregon State value.
US Value
(214.0)
The regional value is compared to the national value.
Prior Value
(105.7)
Prior Value compares a measured value with the previously measured value. Confidence intervals were not taken into account in determining the direction of the comparison.
Trend
This comparison measures the indicator’s values over multiple time periods.<br>The Mann-Kendall Test for Statistical Significance is used to evaluate the trend<br>over 4 to 10 periods of measure, subject to data availability and comparability.
County: Clackamas Syphilis Incidence Rate
County: Clackamas Syphilis Incidence Rate
23.2
Cases per 100,000 population
(2021)
Compared to:
OR Counties
The distribution is based on data from 36 Oregon counties.
OR Value
(22.3)
The regional value is compared to the Oregon State value.
US Value
(16.2)
The regional value is compared to the national value.
Prior Value
(10.3)
Prior Value compares a measured value with the previously measured value. Confidence intervals were not taken into account in determining the direction of the comparison.
Trend
This comparison measures the indicator’s values over multiple time periods.<br>The Mann-Kendall Test for Statistical Significance is used to evaluate the trend<br>over 4 to 10 periods of measure, subject to data availability and comparability.
County: Clackamas
Health / Tobacco Use
Value
Compared to:
County: Clackamas Cigarette Spending-to-Income Ratio
County: Clackamas Cigarette Spending-to-Income Ratio
1.7%
(2023)
Compared to:
OR Counties
The distribution is based on data from 36 Oregon counties.
U.S. Counties
The distribution is based on data from 3,141 U.S. counties and county equivalents.
OR Value
(1.9%)
The regional value is compared to the Oregon State value.
Prior Value
(1.7%)
Prior Value compares a measured value with the previously measured value. Confidence intervals were not taken into account in determining the direction of the comparison.
County: Clackamas
Community / Demographics
Value
Compared to:
County: Clackamas Foreign Born Persons
County: Clackamas Foreign Born Persons
8.5%
(2018-2022)
Compared to:
OR Value
(9.8%)
The regional value is compared to the Oregon State value.
US Value
(13.7%)
The regional value is compared to the national value.
Trend
This comparison measures the indicator’s values over multiple time periods.<br>The Mann-Kendall Test for Statistical Significance is used to evaluate the trend<br>over 4 to 10 periods of measure, subject to data availability and comparability.
County: Clackamas Veteran Population
County: Clackamas Veteran Population
7.1%
(2018-2022)
Compared to:
OR Value
(7.8%)
The regional value is compared to the Oregon State value.
US Value
(6.6%)
The regional value is compared to the national value.
Trend
This comparison measures the indicator’s values over multiple time periods.<br>The Mann-Kendall Test for Statistical Significance is used to evaluate the trend<br>over 4 to 10 periods of measure, subject to data availability and comparability.
County: Clackamas
Community / Public Safety
Value
Compared to:
County: Clackamas Age-Adjusted Death Rate due to Motor Vehicle Collisions
County: Clackamas Age-Adjusted Death Rate due to Motor Vehicle Collisions
5.2
Deaths per 100,000 population
(2016-2020)
Compared to:
OR Value
(5.7)
The regional value is compared to the Oregon State value.
US Value
(2.6)
The regional value is compared to the national value.
Prior Value
(5.1)
Prior Value compares a measured value with the previously measured value. Confidence intervals were taken into account in determining the direction of the comparison.
County: Clackamas Age-Adjusted Death Rate due to Motor Vehicle Traffic Collisions
County: Clackamas Age-Adjusted Death Rate due to Motor Vehicle Traffic Collisions
9.7
Deaths per 100,000 population
(2018-2020)
Compared to:
OR Counties
The distribution is based on data from 20 Oregon counties.
U.S. Counties
The distribution is based on data from 1,266 U.S. counties and county equivalents.
OR Value
(11.1)
The regional value is compared to the Oregon State value.
US Value
(11.4)
The regional value is compared to the national value.
Prior Value
(9.6)
Prior Value compares a measured value with the previously measured value. Confidence intervals were taken into account in determining the direction of the comparison.
Trend
This comparison measures the indicator’s values over multiple time periods.<br>The Mann-Kendall Test for Statistical Significance is used to evaluate the trend<br>over 4 to 10 periods of measure, subject to data availability and comparability.
HP 2030 Target
(10.1)
County: Clackamas
Community / Transportation
Value
Compared to:
County: Clackamas Community Spending on Transportation
County: Clackamas Community Spending on Transportation
15.8%
(2023)
Compared to:
OR Value
(16.0%)
The regional value is compared to the Oregon State value.
US Value
(17.4%)
The regional value is compared to the national value.
Prior Value
(15.8%)
Prior Value compares a measured value with the previously measured value. Confidence intervals were not taken into account in determining the direction of the comparison.
County: Clackamas Gasoline and Other Fuels Spending-to-Income Ratio
County: Clackamas Gasoline and Other Fuels Spending-to-Income Ratio
2.9%
(2023)
Compared to:
OR Counties
The distribution is based on data from 36 Oregon counties.
U.S. Counties
The distribution is based on data from 3,141 U.S. counties and county equivalents.
OR Value
(3.2%)
The regional value is compared to the Oregon State value.
Prior Value
(3.0%)
Prior Value compares a measured value with the previously measured value. Confidence intervals were not taken into account in determining the direction of the comparison.
County: Clackamas Households without a Vehicle
County: Clackamas Households without a Vehicle
4.9%
(2018-2022)
Compared to:
OR Counties
The distribution is based on data from 36 Oregon counties.
U.S. Counties
The distribution is based on data from 3,133 U.S. counties and county equivalents.
OR Value
(7.0%)
The regional value is compared to the Oregon State value.
US Value
(8.3%)
The regional value is compared to the national value.
Trend
This comparison measures the indicator’s values over multiple time periods.<br>The Mann-Kendall Test for Statistical Significance is used to evaluate the trend<br>over 4 to 10 periods of measure, subject to data availability and comparability.
County: Clackamas Mean Travel Time to Work
County: Clackamas Mean Travel Time to Work
27.3
Minutes
(2018-2022)
Compared to:
OR Counties
The distribution is based on data from 36 Oregon counties.
U.S. Counties
The distribution is based on data from 3,131 U.S. counties and county equivalents.
OR Value
(23.3)
The regional value is compared to the Oregon State value.
US Value
(26.7)
The regional value is compared to the national value.
Trend
This comparison measures the indicator’s values over multiple time periods.<br>The Mann-Kendall Test for Statistical Significance is used to evaluate the trend<br>over 4 to 10 periods of measure, subject to data availability and comparability.
County: Clackamas Workers Commuting by Public Transportation
County: Clackamas Workers Commuting by Public Transportation
2.1%
(2018-2022)
Compared to:
OR Counties
The distribution is based on data from 36 Oregon counties.
U.S. Counties
(2015-2019)
The distribution is based on data from 3,142 U.S. counties and county equivalents.
OR Value
(3.0%)
The regional value is compared to the Oregon State value.
US Value
(3.8%)
The regional value is compared to the national value.
Trend
This comparison measures the indicator’s values over multiple time periods.<br>The Mann-Kendall Test for Statistical Significance is used to evaluate the trend<br>over 4 to 10 periods of measure, subject to data availability and comparability.
HP 2030 Target
(5.3%)
County: Clackamas Workers who Drive Alone to Work
County: Clackamas Workers who Drive Alone to Work
70.3%
(2018-2022)
Compared to:
OR Counties
The distribution is based on data from 36 Oregon counties.
U.S. Counties
The distribution is based on data from 3,133 U.S. counties and county equivalents.
OR Value
(67.1%)
The regional value is compared to the Oregon State value.
US Value
(71.7%)
The regional value is compared to the national value.
Trend
This comparison measures the indicator’s values over multiple time periods.<br>The Mann-Kendall Test for Statistical Significance is used to evaluate the trend<br>over 4 to 10 periods of measure, subject to data availability and comparability.
County: Clackamas Workers who Walk to Work
County: Clackamas Workers who Walk to Work
2.2%
(2018-2022)
Compared to:
OR Counties
The distribution is based on data from 36 Oregon counties.
U.S. Counties
The distribution is based on data from 3,133 U.S. counties and county equivalents.
OR Value
(3.4%)
The regional value is compared to the Oregon State value.
US Value
(2.4%)
The regional value is compared to the national value.
Trend
This comparison measures the indicator’s values over multiple time periods.<br>The Mann-Kendall Test for Statistical Significance is used to evaluate the trend<br>over 4 to 10 periods of measure, subject to data availability and comparability.
County: Clackamas
Economy / Food Insecurity
Value
Compared to:
County: Clackamas Community Spending on Food
County: Clackamas Community Spending on Food
12.7%
(2023)
Compared to:
OR Value
(13.0%)
The regional value is compared to the Oregon State value.
US Value
(12.6%)
The regional value is compared to the national value.
Prior Value
(12.7%)
Prior Value compares a measured value with the previously measured value. Confidence intervals were not taken into account in determining the direction of the comparison.
County: Clackamas
Economy / Housing & Homes
Value
Compared to:
County: Clackamas Community Spending on Housing
County: Clackamas Community Spending on Housing
32.2%
(2023)
Compared to:
OR Value
(32.9%)
The regional value is compared to the Oregon State value.
US Value
(32.1%)
The regional value is compared to the national value.
Prior Value
(32.2%)
Prior Value compares a measured value with the previously measured value. Confidence intervals were not taken into account in determining the direction of the comparison.
County: Clackamas Home Renter Spending-to-Income Ratio
County: Clackamas Home Renter Spending-to-Income Ratio
17.3%
(2023)
Compared to:
OR Counties
The distribution is based on data from 36 Oregon counties.
U.S. Counties
The distribution is based on data from 3,141 U.S. counties and county equivalents.
OR Value
(19.6%)
The regional value is compared to the Oregon State value.
Prior Value
(17.4%)
Prior Value compares a measured value with the previously measured value. Confidence intervals were not taken into account in determining the direction of the comparison.
County: Clackamas Homeowner Spending-to-Income Ratio
County: Clackamas Homeowner Spending-to-Income Ratio
14.5%
(2023)
Compared to:
OR Counties
The distribution is based on data from 36 Oregon counties.
U.S. Counties
The distribution is based on data from 3,141 U.S. counties and county equivalents.
OR Value
(15.1%)
The regional value is compared to the Oregon State value.
Prior Value
(14.5%)
Prior Value compares a measured value with the previously measured value. Confidence intervals were not taken into account in determining the direction of the comparison.
County: Clackamas Overcrowded Households
County: Clackamas Overcrowded Households
2.3%
(2018-2022)
Compared to:
OR Counties
The distribution is based on data from 36 Oregon counties.
OR Value
(3.2%)
The regional value is compared to the Oregon State value.
US Value
(3.4%)
The regional value is compared to the national value.
Trend
This comparison measures the indicator’s values over multiple time periods.<br>The Mann-Kendall Test for Statistical Significance is used to evaluate the trend<br>over 4 to 10 periods of measure, subject to data availability and comparability.
County: Clackamas Renters Spending 30% or More of Household Income on Rent
County: Clackamas Renters Spending 30% or More of Household Income on Rent
53.1%
(2018-2022)
Compared to:
OR Counties
The distribution is based on data from 36 Oregon counties.
U.S. Counties
The distribution is based on data from 3,132 U.S. counties and county equivalents.
OR Value
(50.9%)
The regional value is compared to the Oregon State value.
US Value
(49.9%)
The regional value is compared to the national value.
Trend
This comparison measures the indicator’s values over multiple time periods.<br>The Mann-Kendall Test for Statistical Significance is used to evaluate the trend<br>over 4 to 10 periods of measure, subject to data availability and comparability.
HP 2030 Target
(25.5%)
County: Clackamas Utilities Spending-to-Income Ratio
County: Clackamas Utilities Spending-to-Income Ratio
4.9%
(2023)
Compared to:
OR Counties
The distribution is based on data from 36 Oregon counties.
U.S. Counties
The distribution is based on data from 3,141 U.S. counties and county equivalents.
OR Value
(5.5%)
The regional value is compared to the Oregon State value.
Prior Value
(5.0%)
Prior Value compares a measured value with the previously measured value. Confidence intervals were not taken into account in determining the direction of the comparison.
County: Clackamas
Economy / Income
Value
Compared to:
County: Clackamas Median Household Income
County: Clackamas Median Household Income
$95,740
(2018-2022)
Compared to:
OR Counties
The distribution is based on data from 36 Oregon counties.
U.S. Counties
The distribution is based on data from 3,132 U.S. counties and county equivalents.
OR Value
($76,632)
The regional value is compared to the Oregon State value.
US Value
($75,149)
The regional value is compared to the national value.
Trend
This comparison measures the indicator’s values over multiple time periods.<br>The Mann-Kendall Test for Statistical Significance is used to evaluate the trend<br>over 4 to 10 periods of measure, subject to data availability and comparability.
County: Clackamas Per Capita Income
County: Clackamas Per Capita Income
$49,340
(2018-2022)
Compared to:
OR Counties
The distribution is based on data from 36 Oregon counties.
U.S. Counties
The distribution is based on data from 3,133 U.S. counties and county equivalents.
OR Value
($41,805)
The regional value is compared to the Oregon State value.
US Value
($41,261)
The regional value is compared to the national value.
Trend
This comparison measures the indicator’s values over multiple time periods.<br>The Mann-Kendall Test for Statistical Significance is used to evaluate the trend<br>over 4 to 10 periods of measure, subject to data availability and comparability.
County: Clackamas
Economy / Poverty
Value
Compared to:
County: Clackamas Children Living Below Poverty Level
County: Clackamas Children Living Below Poverty Level
7.1%
(2018-2022)
Compared to:
OR Counties
The distribution is based on data from 36 Oregon counties.
U.S. Counties
The distribution is based on data from 3,132 U.S. counties and county equivalents.
OR Value
(13.5%)
The regional value is compared to the Oregon State value.
US Value
(16.7%)
The regional value is compared to the national value.
Trend
This comparison measures the indicator’s values over multiple time periods.<br>The Mann-Kendall Test for Statistical Significance is used to evaluate the trend<br>over 4 to 10 periods of measure, subject to data availability and comparability.
County: Clackamas Families Living Below Poverty Level
County: Clackamas Families Living Below Poverty Level
5.1%
(2018-2022)
Compared to:
OR Counties
The distribution is based on data from 36 Oregon counties.
U.S. Counties
The distribution is based on data from 3,104 U.S. counties and county equivalents.
OR Value
(7.3%)
The regional value is compared to the Oregon State value.
US Value
(8.8%)
The regional value is compared to the national value.
Trend
This comparison measures the indicator’s values over multiple time periods.<br>The Mann-Kendall Test for Statistical Significance is used to evaluate the trend<br>over 4 to 10 periods of measure, subject to data availability and comparability.
County: Clackamas People 65+ Living Below Poverty Level
County: Clackamas People 65+ Living Below Poverty Level
8.1%
(2018-2022)
Compared to:
OR Counties
The distribution is based on data from 36 Oregon counties.
U.S. Counties
The distribution is based on data from 3,133 U.S. counties and county equivalents.
OR Value
(8.8%)
The regional value is compared to the Oregon State value.
US Value
(10.0%)
The regional value is compared to the national value.
Trend
This comparison measures the indicator’s values over multiple time periods.<br>The Mann-Kendall Test for Statistical Significance is used to evaluate the trend<br>over 4 to 10 periods of measure, subject to data availability and comparability.
County: Clackamas People 65+ Living Below Poverty Level (Count)
County: Clackamas People 65+ Living Below Poverty Level (Count)
6,366
People
(2018-2022)
Compared to:
Trend
This comparison measures the indicator’s values over multiple time periods.<br>The Mann-Kendall Test for Statistical Significance is used to evaluate the trend<br>over 4 to 10 periods of measure, subject to data availability and comparability.
County: Clackamas People Living Below Poverty Level
County: Clackamas People Living Below Poverty Level
7.6%
(2018-2022)
Compared to:
OR Counties
The distribution is based on data from 36 Oregon counties.
U.S. Counties
The distribution is based on data from 3,133 U.S. counties and county equivalents.
OR Value
(11.9%)
The regional value is compared to the Oregon State value.
US Value
(12.5%)
The regional value is compared to the national value.
Trend
This comparison measures the indicator’s values over multiple time periods.<br>The Mann-Kendall Test for Statistical Significance is used to evaluate the trend<br>over 4 to 10 periods of measure, subject to data availability and comparability.
HP 2030 Target
(8.0%)
County: Clackamas Youth not in School or Working
County: Clackamas Youth not in School or Working
1.6%
(2018-2022)
Compared to:
OR Counties
The distribution is based on data from 36 Oregon counties.
U.S. Counties
The distribution is based on data from 3,130 U.S. counties and county equivalents.
OR Value
(2.2%)
The regional value is compared to the Oregon State value.
US Value
(1.8%)
The regional value is compared to the national value.
Trend
This comparison measures the indicator’s values over multiple time periods.<br>The Mann-Kendall Test for Statistical Significance is used to evaluate the trend<br>over 4 to 10 periods of measure, subject to data availability and comparability.
County: Clackamas
Education / Childcare & Early Childhood Education
Value
Compared to:
County: Clackamas Day Care Center and Preschool Spending-to-Income Ratio
County: Clackamas Day Care Center and Preschool Spending-to-Income Ratio
6.6%
(2023)
Compared to:
OR Counties
The distribution is based on data from 36 Oregon counties.
U.S. Counties
The distribution is based on data from 3,141 U.S. counties and county equivalents.
OR Value
(7.2%)
The regional value is compared to the Oregon State value.
Prior Value
(6.6%)
Prior Value compares a measured value with the previously measured value. Confidence intervals were not taken into account in determining the direction of the comparison.
County: Clackamas Home Child Care Spending-to-Income Ratio
County: Clackamas Home Child Care Spending-to-Income Ratio
3.1%
(2023)
Compared to:
OR Counties
The distribution is based on data from 36 Oregon counties.
U.S. Counties
The distribution is based on data from 3,141 U.S. counties and county equivalents.
OR Value
(3.5%)
The regional value is compared to the Oregon State value.
Prior Value
(3.1%)
Prior Value compares a measured value with the previously measured value. Confidence intervals were not taken into account in determining the direction of the comparison.
County: Clackamas
Education / Educational Attainment
Value
Compared to:
County: Clackamas College Tuition Spending-to-Income Ratio
County: Clackamas College Tuition Spending-to-Income Ratio
11.0%
(2023)
Compared to:
OR Counties
The distribution is based on data from 36 Oregon counties.
U.S. Counties
The distribution is based on data from 3,141 U.S. counties and county equivalents.
OR Value
(12.4%)
The regional value is compared to the Oregon State value.
Prior Value
(11.1%)
Prior Value compares a measured value with the previously measured value. Confidence intervals were not taken into account in determining the direction of the comparison.
County: Clackamas Community Spending on Education
County: Clackamas Community Spending on Education
2.5%
(2023)
Compared to:
OR Value
(2.5%)
The regional value is compared to the Oregon State value.
US Value
(2.4%)
The regional value is compared to the national value.
Prior Value
(2.5%)
Prior Value compares a measured value with the previously measured value. Confidence intervals were not taken into account in determining the direction of the comparison.
County: Clackamas People 25+ with a Bachelor's Degree or Higher
County: Clackamas People 25+ with a Bachelor's Degree or Higher
39.2%
(2018-2022)
Compared to:
OR Counties
The distribution is based on data from 36 Oregon counties.
U.S. Counties
The distribution is based on data from 3,133 U.S. counties and county equivalents.
OR Value
(35.5%)
The regional value is compared to the Oregon State value.
US Value
(34.3%)
The regional value is compared to the national value.
Trend
This comparison measures the indicator’s values over multiple time periods.<br>The Mann-Kendall Test for Statistical Significance is used to evaluate the trend<br>over 4 to 10 periods of measure, subject to data availability and comparability.
County: Clackamas People 25+ with a High School Diploma or Higher
County: Clackamas People 25+ with a High School Diploma or Higher
94.4%
(2018-2022)
Compared to:
OR Counties
The distribution is based on data from 36 Oregon counties.
U.S. Counties
The distribution is based on data from 3,133 U.S. counties and county equivalents.
OR Value
(91.6%)
The regional value is compared to the Oregon State value.
US Value
(89.1%)
The regional value is compared to the national value.
Trend
This comparison measures the indicator’s values over multiple time periods.<br>The Mann-Kendall Test for Statistical Significance is used to evaluate the trend<br>over 4 to 10 periods of measure, subject to data availability and comparability.
County: Clackamas Student Loan Spending-to-Income Ratio
County: Clackamas Student Loan Spending-to-Income Ratio
3.9%
(2023)
Compared to:
OR Counties
The distribution is based on data from 36 Oregon counties.
U.S. Counties
The distribution is based on data from 3,141 U.S. counties and county equivalents.
OR Value
(4.4%)
The regional value is compared to the Oregon State value.
Prior Value
(3.9%)
Prior Value compares a measured value with the previously measured value. Confidence intervals were not taken into account in determining the direction of the comparison.
County: Clackamas Vocational, Technical, and Other School Tuition Spending-to-Income Ratio
County: Clackamas Vocational, Technical, and Other School Tuition Spending-to-Income Ratio
1.3%
(2023)
Compared to:
OR Counties
The distribution is based on data from 36 Oregon counties.
U.S. Counties
The distribution is based on data from 3,141 U.S. counties and county equivalents.
OR Value
(1.5%)
The regional value is compared to the Oregon State value.
Prior Value
(1.3%)
Prior Value compares a measured value with the previously measured value. Confidence intervals were not taken into account in determining the direction of the comparison.
County: Clackamas
Environmental Health / Built Environment
Value
Compared to:
County: Clackamas Access to Parks
County: Clackamas Access to Parks
83.2%
(2020)
Compared to:
OR Counties
The distribution is based on data from 36 Oregon counties.
OR Value
(90.4%)
The regional value is compared to the Oregon State value.
Prior Value
(79.3%)
Prior Value compares a measured value with the previously measured value. Confidence intervals were not taken into account in determining the direction of the comparison.
