Search for Indicators
PHAB Data
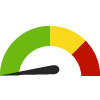
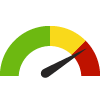
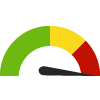
Indicator Gauge Icon Legend
Legend Colors
Red is bad, green is good, blue is not statistically different/neutral.
Compared to Distribution
 the value is in the best half of communities.
 the value is in the 2nd worst quarter of communities.
 the value is in the worst quarter of communities.
Compared to Target
 meets target;
  does not meet target.
Compared to a Single Value
 lower than the comparison value;
 higher than the comparison value;
 not statistically different from comparison value.
Trend

 non-significant change over time;
 significant change over time;
  no change over time.
Compared to Prior Value
 higher than the previous measurement period;
 lower than the previous measurement period;
 no statistically different change from previous measurement period.
Mortality
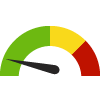
Death Rate due to Drug Poisoning County: Clackamas
Death Rate due to Drug Poisoning County: Clackamas
13.8
Deaths per 100,000 population
(2019-2021)
Compared to:
OR Counties
The distribution is based on data from 27 Oregon counties.
U.S. Counties
The distribution is based on data from 1,899 U.S. counties and county equivalents.
OR Value
(20.4)
The regional value is compared to the Oregon State value.
US Value
(27.2)
The regional value is compared to the national value.
HP 2030 Target
(20.7)
<div>SU-03: Reduce drug overdose deaths <strong>(LEADING HEALTH INDICATOR)</strong></div>
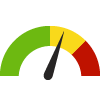
Age-Adjusted Death Rate due to Alzheimer's Disease County: Clackamas
Age-Adjusted Death Rate due to Alzheimer's Disease County: Clackamas
36.9
Deaths per 100,000 population
(2018-2020)
Compared to:


OR Counties
The distribution is based on data from 27 Oregon counties.
U.S. Counties
The distribution is based on data from 2,140 U.S. counties and county equivalents.
OR Value
(36.6)
The regional value is compared to the Oregon State value.
US Value
(31.0)
The regional value is compared to the national value.
Prior Value
(35.7)
Prior Value compares a measured value with the previously measured value. Confidence intervals were taken into account in determining the direction of the comparison.
Trend
This comparison measures the indicator’s values over multiple time periods.<br>The Mann-Kendall Test for Statistical Significance is used to evaluate the trend<br>over 4 to 10 periods of measure, subject to data availability and comparability.
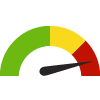
Death Rate due to Alzheimer's Disease County: Clackamas
Death Rate due to Alzheimer's Disease County: Clackamas
52.4
Deaths per 100,000 population
(2021)
Compared to:

OR Counties
The distribution is based on data from 36 Oregon counties.
OR Value
(48.0)
The regional value is compared to the Oregon State value.
Prior Value
(49.9)
Prior Value compares a measured value with the previously measured value. Confidence intervals were not taken into account in determining the direction of the comparison.
Trend
This comparison measures the indicator’s values over multiple time periods.<br>The Mann-Kendall Test for Statistical Significance is used to evaluate the trend<br>over 4 to 10 periods of measure, subject to data availability and comparability.
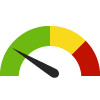
Age-Adjusted Death Rate due to Motor Vehicle Traffic Collisions County: Clackamas
Age-Adjusted Death Rate due to Motor Vehicle Traffic Collisions County: Clackamas
9.7
Deaths per 100,000 population
(2018-2020)
Compared to:

OR Counties
The distribution is based on data from 20 Oregon counties.
U.S. Counties
The distribution is based on data from 1,266 U.S. counties and county equivalents.
OR Value
(11.1)
The regional value is compared to the Oregon State value.
US Value
(11.4)
The regional value is compared to the national value.
Prior Value
(9.6)
Prior Value compares a measured value with the previously measured value. Confidence intervals were taken into account in determining the direction of the comparison.
Trend
This comparison measures the indicator’s values over multiple time periods.<br>The Mann-Kendall Test for Statistical Significance is used to evaluate the trend<br>over 4 to 10 periods of measure, subject to data availability and comparability.
HP 2030 Target
(10.1)
Age-Adjusted Death Rate due to Cancer County: Clackamas
Age-Adjusted Death Rate due to Cancer County: Clackamas
146.1
Deaths per 100,000 population
(2016-2020)
Compared to:
OR Counties
The distribution is based on data from 36 Oregon counties.
U.S. Counties
The distribution is based on data from 3,085 U.S. counties and county equivalents.
OR Value
(150.6)
The regional value is compared to the Oregon State value.
US Value
(149.4)
The regional value is compared to the national value.
Prior Value
(147.5)
Prior Value compares a measured value with the previously measured value. Confidence intervals were taken into account in determining the direction of the comparison.
Trend
This comparison measures the indicator’s values over multiple time periods.<br>The Mann-Kendall Test for Statistical Significance is used to evaluate the trend<br>over 4 to 10 periods of measure, subject to data availability and comparability.
HP 2030 Target
(122.7)
Age-Adjusted Death Rate due to Heart Attack County: Clackamas
Age-Adjusted Death Rate due to Heart Attack County: Clackamas
28.2
Deaths per 100,000 population 35+ years
(2020)
Compared to:
OR Counties
The distribution is based on data from 22 Oregon counties.
OR Value
(35.5)
The regional value is compared to the Oregon State value.
Prior Value
(31.6)
Prior Value compares a measured value with the previously measured value. Confidence intervals were not taken into account in determining the direction of the comparison.
Trend
This comparison measures the indicator’s values over multiple time periods.<br>The Mann-Kendall Test for Statistical Significance is used to evaluate the trend<br>over 4 to 10 periods of measure, subject to data availability and comparability.
Death Rate due to Heart Disease County: Clackamas
Death Rate due to Heart Disease County: Clackamas
173.5
Deaths per 100,000 population
(2021)
Compared to:
OR Counties
The distribution is based on data from 36 Oregon counties.
OR Value
(183.2)
The regional value is compared to the Oregon State value.
Prior Value
(153.6)
Prior Value compares a measured value with the previously measured value. Confidence intervals were not taken into account in determining the direction of the comparison.
Trend
This comparison measures the indicator’s values over multiple time periods.<br>The Mann-Kendall Test for Statistical Significance is used to evaluate the trend<br>over 4 to 10 periods of measure, subject to data availability and comparability.
Age-Adjusted Death Rate due to Cerebrovascular Disease (Stroke) County: Clackamas
Age-Adjusted Death Rate due to Cerebrovascular Disease (Stroke) County: Clackamas
41.2
Deaths per 100,000 population
(2018-2020)
Compared to:
OR Counties
The distribution is based on data from 30 Oregon counties.
U.S. Counties
The distribution is based on data from 2,338 U.S. counties and county equivalents.
OR Value
(39.3)
The regional value is compared to the Oregon State value.
US Value
(37.6)
The regional value is compared to the national value.
Prior Value
(39.1)
Prior Value compares a measured value with the previously measured value. Confidence intervals were taken into account in determining the direction of the comparison.
Trend
This comparison measures the indicator’s values over multiple time periods.<br>The Mann-Kendall Test for Statistical Significance is used to evaluate the trend<br>over 4 to 10 periods of measure, subject to data availability and comparability.
HP 2030 Target
(33.4)
Death Rate due to Cerebrovascular Disease (Stroke) County: Clackamas
Death Rate due to Cerebrovascular Disease (Stroke) County: Clackamas
60.2
Deaths per 100,000 population
(2021)
Compared to:
OR Counties
The distribution is based on data from 36 Oregon counties.
OR Value
(54.4)
The regional value is compared to the Oregon State value.
Prior Value
(63.1)
Prior Value compares a measured value with the previously measured value. Confidence intervals were not taken into account in determining the direction of the comparison.
Trend
This comparison measures the indicator’s values over multiple time periods.<br>The Mann-Kendall Test for Statistical Significance is used to evaluate the trend<br>over 4 to 10 periods of measure, subject to data availability and comparability.
Age-Adjusted Death Rate due to Chronic Lower Respiratory Diseases County: Clackamas
Age-Adjusted Death Rate due to Chronic Lower Respiratory Diseases County: Clackamas
29.1
Deaths per 100,000 population
(2018-2020)
Compared to:
OR Counties
The distribution is based on data from 29 Oregon counties.
U.S. Counties
The distribution is based on data from 2,518 U.S. counties and county equivalents.
OR Value
(36.0)
The regional value is compared to the Oregon State value.
US Value
(38.1)
The regional value is compared to the national value.
Prior Value
(31.0)
Prior Value compares a measured value with the previously measured value. Confidence intervals were taken into account in determining the direction of the comparison.
Trend
This comparison measures the indicator’s values over multiple time periods.<br>The Mann-Kendall Test for Statistical Significance is used to evaluate the trend<br>over 4 to 10 periods of measure, subject to data availability and comparability.
Death Rate due to Chronic Lower Respiratory Diseases County: Clackamas
Death Rate due to Chronic Lower Respiratory Diseases County: Clackamas
36.0
Deaths per 100,000 population
(2021)
Compared to:
OR Counties
The distribution is based on data from 36 Oregon counties.
OR Value
(44.5)
The regional value is compared to the Oregon State value.
Prior Value
(33.8)
Prior Value compares a measured value with the previously measured value. Confidence intervals were not taken into account in determining the direction of the comparison.
Trend
This comparison measures the indicator’s values over multiple time periods.<br>The Mann-Kendall Test for Statistical Significance is used to evaluate the trend<br>over 4 to 10 periods of measure, subject to data availability and comparability.
Age-Adjusted Death Rate due to Influenza and Pneumonia County: Clackamas
Age-Adjusted Death Rate due to Influenza and Pneumonia County: Clackamas
6.4
Deaths per 100,000 population
(2018-2020)
Compared to:
U.S. Counties
The distribution is based on data from 1,449 U.S. counties and county equivalents.
OR Value
(8.7)
The regional value is compared to the Oregon State value.
US Value
(13.4)
The regional value is compared to the national value.
Prior Value
(8.8)
Prior Value compares a measured value with the previously measured value. Confidence intervals were taken into account in determining the direction of the comparison.
Trend
This comparison measures the indicator’s values over multiple time periods.<br>The Mann-Kendall Test for Statistical Significance is used to evaluate the trend<br>over 4 to 10 periods of measure, subject to data availability and comparability.
Death Rate due to Influenza and Pneumonia County: Clackamas
Death Rate due to Influenza and Pneumonia County: Clackamas
3.1
Deaths per 100,000 population
(2021)
Compared to:
OR Counties
(2019)
The distribution is based on data from 36 Oregon counties.
OR Value
(5.3)
The regional value is compared to the Oregon State value.
Prior Value
(4.2)
Prior Value compares a measured value with the previously measured value. Confidence intervals were not taken into account in determining the direction of the comparison.
Trend
This comparison measures the indicator’s values over multiple time periods.<br>The Mann-Kendall Test for Statistical Significance is used to evaluate the trend<br>over 4 to 10 periods of measure, subject to data availability and comparability.
COVID-19 Daily Average Case-Fatality Rate County: Clackamas
COVID-19 Daily Average Case-Fatality Rate County: Clackamas
1.2
Deaths per 100 cases
(Mar 3, 2023)
Compared to:
OR Counties
(Feb 3, 2023)
The distribution is based on data from 32 Oregon counties.
U.S. Counties
(Mar 25, 2022)
The distribution is based on data from 2,811 U.S. counties and county equivalents.
OR Value
(1.4)
The regional value is compared to the Oregon State value.
US Value
(1.7)
The regional value is compared to the national value.
Prior Value
(2.5)
Prior Value compares a measured value with the previously measured value. Confidence intervals were not taken into account in determining the direction of the comparison.
Trend
This comparison measures the indicator’s values over multiple time periods.<br>The Mann-Kendall Test for Statistical Significance is used to evaluate the trend<br>over 4 to 10 periods of measure, subject to data availability and comparability.
Age-Adjusted Death Rate due to Diabetes County: Clackamas
Age-Adjusted Death Rate due to Diabetes County: Clackamas
19.7
Deaths per 100,000 population
(2018-2020)
Compared to:
OR Counties
The distribution is based on data from 25 Oregon counties.
U.S. Counties
The distribution is based on data from 1,937 U.S. counties and county equivalents.
OR Value
(23.4)
The regional value is compared to the Oregon State value.
US Value
(22.6)
The regional value is compared to the national value.
Prior Value
(20.7)
Prior Value compares a measured value with the previously measured value. Confidence intervals were taken into account in determining the direction of the comparison.
Trend
This comparison measures the indicator’s values over multiple time periods.<br>The Mann-Kendall Test for Statistical Significance is used to evaluate the trend<br>over 4 to 10 periods of measure, subject to data availability and comparability.
Death Rate due to Diabetes County: Clackamas
Death Rate due to Diabetes County: Clackamas
29.6
Deaths per 100,000 population
(2021)
Compared to:
OR Counties
The distribution is based on data from 36 Oregon counties.
OR Value
(33.7)
The regional value is compared to the Oregon State value.
Prior Value
(26.7)
Prior Value compares a measured value with the previously measured value. Confidence intervals were not taken into account in determining the direction of the comparison.
Trend
This comparison measures the indicator’s values over multiple time periods.<br>The Mann-Kendall Test for Statistical Significance is used to evaluate the trend<br>over 4 to 10 periods of measure, subject to data availability and comparability.
Age-Adjusted Death Rate due to Homicide County: Clackamas
Age-Adjusted Death Rate due to Homicide County: Clackamas
2.1
Deaths per 100,000 population
(2018-2020)
Compared to:
U.S. Counties
The distribution is based on data from 495 U.S. counties and county equivalents.
OR Value
(3.1)
The regional value is compared to the Oregon State value.
US Value
(6.6)
The regional value is compared to the national value.
Prior Value
(2.1)
Prior Value compares a measured value with the previously measured value. Confidence intervals were taken into account in determining the direction of the comparison.
Trend
This comparison measures the indicator’s values over multiple time periods.<br>The Mann-Kendall Test for Statistical Significance is used to evaluate the trend<br>over 4 to 10 periods of measure, subject to data availability and comparability.
HP 2030 Target
(5.5)
<div>IVP-09: Reduce homicides <strong>(LEADING HEALTH INDICATOR)</strong></div>
Infant Mortality Rate County: Clackamas
Infant Mortality Rate County: Clackamas
2.9
Deaths per 1,000 live births
(2021)
Compared to:
OR Value
(3.8)
The regional value is compared to the Oregon State value.
US Value
(5.4)
The regional value is compared to the national value. The source for the national value is Centers for Disease Control and Prevention
Prior Value
(5.0)
Prior Value compares a measured value with the previously measured value. Confidence intervals were not taken into account in determining the direction of the comparison.
Trend
This comparison measures the indicator’s values over multiple time periods.<br>The Mann-Kendall Test for Statistical Significance is used to evaluate the trend<br>over 4 to 10 periods of measure, subject to data availability and comparability.
HP 2030 Target
(5.0)
<div>MICH-02: Reduce the rate of infant deaths <strong>(LEADING HEALTH INDICATOR)</strong></div>
Life Expectancy County: Clackamas
Life Expectancy County: Clackamas
80.2
Years
(2019-2021)
Compared to:
OR Counties
The distribution is based on data from 35 Oregon counties.
U.S. Counties
The distribution is based on data from 3,070 U.S. counties and county equivalents.
OR Value
(78.7)
The regional value is compared to the Oregon State value.
US Value
(77.6)
The regional value is compared to the national value.
Age-Adjusted Death Rate due to Unintentional Injuries County: Clackamas
Age-Adjusted Death Rate due to Unintentional Injuries County: Clackamas
38.5
Deaths per 100,000 population
(2018-2020)
Compared to:
OR Counties
The distribution is based on data from 31 Oregon counties.
U.S. Counties
The distribution is based on data from 2,454 U.S. counties and county equivalents.
OR Value
(47.2)
The regional value is compared to the Oregon State value.
US Value
(51.6)
The regional value is compared to the national value.
Prior Value
(36.0)
Prior Value compares a measured value with the previously measured value. Confidence intervals were taken into account in determining the direction of the comparison.
Trend
This comparison measures the indicator’s values over multiple time periods.<br>The Mann-Kendall Test for Statistical Significance is used to evaluate the trend<br>over 4 to 10 periods of measure, subject to data availability and comparability.
HP 2030 Target
(43.2)
Age-Adjusted Death Rate due to Kidney Disease County: Clackamas
Age-Adjusted Death Rate due to Kidney Disease County: Clackamas
6.2
Deaths per 100,000 population
(2018-2020)
Compared to:
U.S. Counties
The distribution is based on data from 1,416 U.S. counties and county equivalents.
OR Value
(7.4)
The regional value is compared to the Oregon State value.
US Value
(12.8)
The regional value is compared to the national value.
Prior Value
(6.6)
Prior Value compares a measured value with the previously measured value. Confidence intervals were taken into account in determining the direction of the comparison.
Trend
This comparison measures the indicator’s values over multiple time periods.<br>The Mann-Kendall Test for Statistical Significance is used to evaluate the trend<br>over 4 to 10 periods of measure, subject to data availability and comparability.
Age-Adjusted Death Rate due to Suicide County: Clackamas
Age-Adjusted Death Rate due to Suicide County: Clackamas
16.4
Deaths per 100,000 population
(2018-2020)
Compared to:
OR Counties
The distribution is based on data from 23 Oregon counties.
U.S. Counties
The distribution is based on data from 1,307 U.S. counties and county equivalents.
OR Value
(19.2)
The regional value is compared to the Oregon State value.
US Value
(13.9)
The regional value is compared to the national value.
Prior Value
(15.9)
Prior Value compares a measured value with the previously measured value. Confidence intervals were taken into account in determining the direction of the comparison.
Trend
This comparison measures the indicator’s values over multiple time periods.<br>The Mann-Kendall Test for Statistical Significance is used to evaluate the trend<br>over 4 to 10 periods of measure, subject to data availability and comparability.
HP 2030 Target
(12.8)
<div>MHMD-01: Reduce the suicide rate <strong>(LEADING HEALTH INDICATOR)</strong></div>
Health Related Quality of Life
Adults with Current Asthma County: Clackamas
Adults with Current Asthma County: Clackamas
10.6%
(2021)
Compared to:
OR Counties
The distribution is based on data from 36 Oregon counties.
U.S. Counties
The distribution is based on data from 3,074 U.S. counties and county equivalents.
US Value
(9.7%)
The regional value is compared to the national value.
Adults with Cancer County: Clackamas
Adults with Cancer County: Clackamas
7.7%
(2021)
Compared to:
OR Counties
The distribution is based on data from 36 Oregon counties.
U.S. Counties
The distribution is based on data from 3,074 U.S. counties and county equivalents.
US Value
(7.0%)
The regional value is compared to the national value.
All Cancer Incidence Rate County: Clackamas
All Cancer Incidence Rate County: Clackamas
443.8
Cases per 100,000 population
(2016-2020)
Compared to:
OR Counties
The distribution is based on data from 36 Oregon counties.
U.S. Counties
The distribution is based on data from 2,693 U.S. counties and county equivalents.
OR Value
(419.2)
The regional value is compared to the Oregon State value.
US Value
(442.3)
The regional value is compared to the national value.
Prior Value
(455.3)
Prior Value compares a measured value with the previously measured value. Confidence intervals were taken into account in determining the direction of the comparison.
Trend
This comparison measures the indicator’s values over multiple time periods.<br>The Mann-Kendall Test for Statistical Significance is used to evaluate the trend<br>over 4 to 10 periods of measure, subject to data availability and comparability.
Adults with COPD County: Clackamas
Adults with COPD County: Clackamas
5.9%
Percent of adults
(2021)
Compared to:
OR Counties
The distribution is based on data from 36 Oregon counties.
U.S. Counties
The distribution is based on data from 3,074 U.S. counties and county equivalents.
US Value
(6.4%)
The regional value is compared to the national value.
Tuberculosis Cases County: Clackamas
Tuberculosis Cases County: Clackamas
4
Cases
(2022)
Compared to:
Prior Value
(8)
Prior Value compares a measured value with the previously measured value. Confidence intervals were not taken into account in determining the direction of the comparison.
Trend
This comparison measures the indicator’s values over multiple time periods.<br>The Mann-Kendall Test for Statistical Significance is used to evaluate the trend<br>over 4 to 10 periods of measure, subject to data availability and comparability.
COVID-19 Daily Average Incidence Rate County: Clackamas
COVID-19 Daily Average Incidence Rate County: Clackamas
5.71
Cases per 100,000 population
(Mar 3, 2023)
Compared to:
OR Counties
The distribution is based on data from 36 Oregon counties.
U.S. Counties
The distribution is based on data from 3,142 U.S. counties and county equivalents.
OR Value
(7.92)
The regional value is compared to the Oregon State value.
US Value
(10.97)
The regional value is compared to the national value.
Prior Value
(6.61)
Prior Value compares a measured value with the previously measured value. Confidence intervals were not taken into account in determining the direction of the comparison.
Trend
This comparison measures the indicator’s values over multiple time periods.<br>The Mann-Kendall Test for Statistical Significance is used to evaluate the trend<br>over 4 to 10 periods of measure, subject to data availability and comparability.
Adults Ever Diagnosed with Depression County: Clackamas
Adults Ever Diagnosed with Depression County: Clackamas
24.2%
(2021)
Compared to:
OR Counties
The distribution is based on data from 36 Oregon counties.
U.S. Counties
The distribution is based on data from 3,074 U.S. counties and county equivalents.
US Value
(19.5%)
The regional value is compared to the national value.
Persons with a Disability County: Clackamas
Persons with a Disability County: Clackamas
12.6%
(2018-2022)
Compared to:


OR Value
(14.9%)
The regional value is compared to the Oregon State value.
US Value
(12.9%)
The regional value is compared to the national value.
Trend
This comparison measures the indicator’s values over multiple time periods.<br>The Mann-Kendall Test for Statistical Significance is used to evaluate the trend<br>over 4 to 10 periods of measure, subject to data availability and comparability.
HIV Diagnosed Cases County: Clackamas
HIV Diagnosed Cases County: Clackamas
82
Cases
(2017-2021)
Compared to:
Prior Value
(82)
Prior Value compares a measured value with the previously measured value. Confidence intervals were not taken into account in determining the direction of the comparison.
Trend
This comparison measures the indicator’s values over multiple time periods.<br>The Mann-Kendall Test for Statistical Significance is used to evaluate the trend<br>over 4 to 10 periods of measure, subject to data availability and comparability.
High Blood Pressure Prevalence County: Clackamas
High Blood Pressure Prevalence County: Clackamas
30.3%
(2021)
Compared to:
OR Counties
The distribution is based on data from 36 Oregon counties.
U.S. Counties
The distribution is based on data from 3,074 U.S. counties and county equivalents.
US Value
(32.7%)
The regional value is compared to the national value.
HP 2030 Target
(41.9%)
Babies with Low Birthweight County: Clackamas
Babies with Low Birthweight County: Clackamas
6.1%
(2021)
Compared to:
OR Counties
The distribution is based on data from 33 Oregon counties.
OR Value
(6.9%)
The regional value is compared to the Oregon State value.
US Value
(8.5%)
The regional value is compared to the national value. The source for the national value is Centers for Disease Control and Prevention
Prior Value
(5.4%)
Prior Value compares a measured value with the previously measured value. Confidence intervals were not taken into account in determining the direction of the comparison.
Trend
This comparison measures the indicator’s values over multiple time periods.<br>The Mann-Kendall Test for Statistical Significance is used to evaluate the trend<br>over 4 to 10 periods of measure, subject to data availability and comparability.
Adults who Experienced Coronary Heart Disease County: Clackamas
Adults who Experienced Coronary Heart Disease County: Clackamas
5.9%
(2021)
Compared to:
OR Counties
The distribution is based on data from 36 Oregon counties.
U.S. Counties
The distribution is based on data from 3,074 U.S. counties and county equivalents.
US Value
(6.1%)
The regional value is compared to the national value.
Poor Mental Health: 14+ Days County: Clackamas
Poor Mental Health: 14+ Days County: Clackamas
14.9%
(2021)
Compared to:
OR Counties
The distribution is based on data from 36 Oregon counties.
U.S. Counties
The distribution is based on data from 3,074 U.S. counties and county equivalents.
US Value
(14.7%)
The regional value is compared to the national value.
Poor Mental Health: Average Number of Days County: Clackamas
Poor Mental Health: Average Number of Days County: Clackamas
5.1
Days
(2021)
Compared to:
OR Counties
The distribution is based on data from 36 Oregon counties.
U.S. Counties
The distribution is based on data from 3,141 U.S. counties and county equivalents.
OR Value
(5.4)
The regional value is compared to the Oregon State value.
US Value
(4.8)
The regional value is compared to the national value.
Prior Value
(4.6)
Prior Value compares a measured value with the previously measured value. Confidence intervals were taken into account in determining the direction of the comparison.
Trend
This comparison measures the indicator’s values over multiple time periods.<br>The Mann-Kendall Test for Statistical Significance is used to evaluate the trend<br>over 4 to 10 periods of measure, subject to data availability and comparability.
Chlamydia Incidence Rate County: Clackamas
Chlamydia Incidence Rate County: Clackamas
271.2
Cases per 100,000 population
(2021)
Compared to:
OR Counties
The distribution is based on data from 36 Oregon counties.
U.S. Counties
The distribution is based on data from 2,800 U.S. counties and county equivalents.
OR Value
(367.3)
The regional value is compared to the Oregon State value.
US Value
(495.5)
The regional value is compared to the national value.
Prior Value
(270.7)
Prior Value compares a measured value with the previously measured value. Confidence intervals were not taken into account in determining the direction of the comparison.
Trend
This comparison measures the indicator’s values over multiple time periods.<br>The Mann-Kendall Test for Statistical Significance is used to evaluate the trend<br>over 4 to 10 periods of measure, subject to data availability and comparability.
Gonorrhea Incidence Rate County: Clackamas
Gonorrhea Incidence Rate County: Clackamas
86.1
Cases per 100,000 population
(2021)
Compared to:
OR Counties
The distribution is based on data from 36 Oregon counties.
U.S. Counties
The distribution is based on data from 3,117 U.S. counties and county equivalents.
OR Value
(146.5)
The regional value is compared to the Oregon State value.
US Value
(214.0)
The regional value is compared to the national value.
Prior Value
(105.7)
Prior Value compares a measured value with the previously measured value. Confidence intervals were not taken into account in determining the direction of the comparison.
Trend
This comparison measures the indicator’s values over multiple time periods.<br>The Mann-Kendall Test for Statistical Significance is used to evaluate the trend<br>over 4 to 10 periods of measure, subject to data availability and comparability.
Syphilis Incidence Rate County: Clackamas
Syphilis Incidence Rate County: Clackamas
23.2
Cases per 100,000 population
(2021)
Compared to:
OR Counties
The distribution is based on data from 36 Oregon counties.
OR Value
(22.3)
The regional value is compared to the Oregon State value.
US Value
(16.2)
The regional value is compared to the national value.
Prior Value
(10.3)
Prior Value compares a measured value with the previously measured value. Confidence intervals were not taken into account in determining the direction of the comparison.
Trend
This comparison measures the indicator’s values over multiple time periods.<br>The Mann-Kendall Test for Statistical Significance is used to evaluate the trend<br>over 4 to 10 periods of measure, subject to data availability and comparability.
Preventive Health Care
Mammography Screening: Medicare Population County: Clackamas
Mammography Screening: Medicare Population County: Clackamas
45.0%
(2022)
Compared to:


OR Counties
The distribution is based on data from 36 Oregon counties.
U.S. Counties
The distribution is based on data from 3,123 U.S. counties and county equivalents.
OR Value
(45.0%)
The regional value is compared to the Oregon State value.
US Value
(47.0%)
The regional value is compared to the national value.
Prior Value
(46.0%)
Prior Value compares a measured value with the previously measured value. Confidence intervals were not taken into account in determining the direction of the comparison.
Trend
This comparison measures the indicator’s values over multiple time periods.<br>The Mann-Kendall Test for Statistical Significance is used to evaluate the trend<br>over 4 to 10 periods of measure, subject to data availability and comparability.
Children Up-to-Date on Immunizations: 2 Years County: Clackamas
Children Up-to-Date on Immunizations: 2 Years County: Clackamas
70.0%
(2022)
Compared to:
OR Value
(69.0%)
The regional value is compared to the Oregon State value.
Prior Value
(74.0%)
Prior Value compares a measured value with the previously measured value. Confidence intervals were not taken into account in determining the direction of the comparison.
Trend
This comparison measures the indicator’s values over multiple time periods.<br>The Mann-Kendall Test for Statistical Significance is used to evaluate the trend<br>over 4 to 10 periods of measure, subject to data availability and comparability.
Adolescents Up-to-Date on Immunizations: 13-year-old County: Clackamas
Adolescents Up-to-Date on Immunizations: 13-year-old County: Clackamas
36.0%
(2022)
Compared to:
OR Value
(33.0%)
The regional value is compared to the Oregon State value.
Prior Value
(36.0%)
Prior Value compares a measured value with the previously measured value. Confidence intervals were not taken into account in determining the direction of the comparison.
Trend
This comparison measures the indicator’s values over multiple time periods.<br>The Mann-Kendall Test for Statistical Significance is used to evaluate the trend<br>over 4 to 10 periods of measure, subject to data availability and comparability.
Colon Cancer Screening County: Clackamas
Colon Cancer Screening County: Clackamas
71.2%
(2018)
Compared to:
OR Counties
The distribution is based on data from 36 Oregon counties.
U.S. Counties
The distribution is based on data from 3,142 U.S. counties and county equivalents.
US Value
(66.4%)
The regional value is compared to the national value.
Persons Fully Vaccinated Against COVID-19 County: Clackamas
Persons Fully Vaccinated Against COVID-19 County: Clackamas
71.9%
(May 10, 2023)
Compared to:
OR Counties
The distribution is based on data from 36 Oregon counties.
U.S. Counties
The distribution is based on data from 3,125 U.S. counties and county equivalents.
Prior Value
(71.9%)
Prior Value compares a measured value with the previously measured value. Confidence intervals were not taken into account in determining the direction of the comparison.
Trend
This comparison measures the indicator’s values over multiple time periods.<br>The Mann-Kendall Test for Statistical Significance is used to evaluate the trend<br>over 4 to 10 periods of measure, subject to data availability and comparability.
Dentist Rate County: Clackamas
Dentist Rate County: Clackamas
88
Dentists per 100,000 population
(2022)
Compared to:
OR Counties
The distribution is based on data from 36 Oregon counties.
U.S. Counties
The distribution is based on data from 3,054 U.S. counties and county equivalents.
OR Value
(85)
The regional value is compared to the Oregon State value.
Prior Value
(85)
Prior Value compares a measured value with the previously measured value. Confidence intervals were not taken into account in determining the direction of the comparison.
Trend
This comparison measures the indicator’s values over multiple time periods.<br>The Mann-Kendall Test for Statistical Significance is used to evaluate the trend<br>over 4 to 10 periods of measure, subject to data availability and comparability.
Persons with Health Insurance County: Clackamas
Persons with Health Insurance County: Clackamas
94.3%
(2021)
Compared to:
OR Counties
The distribution is based on data from 36 Oregon counties.
U.S. Counties
The distribution is based on data from 3,140 U.S. counties and county equivalents.
OR Value
(92.6%)
The regional value is compared to the Oregon State value.
Prior Value
(93.8%)
Prior Value compares a measured value with the previously measured value. Confidence intervals were taken into account in determining the direction of the comparison.
Trend
This comparison measures the indicator’s values over multiple time periods.<br>The Mann-Kendall Test for Statistical Significance is used to evaluate the trend<br>over 4 to 10 periods of measure, subject to data availability and comparability.
HP 2030 Target
(92.4%)
<div>AHS-01: Increase the proportion of people with health insurance <strong>(LEADING HEALTH INDICATOR)</strong></div>
Flu Vaccinations: Medicare Population County: Clackamas
Flu Vaccinations: Medicare Population County: Clackamas
50.0%
(2022)
Compared to:
OR Counties
The distribution is based on data from 36 Oregon counties.
U.S. Counties
The distribution is based on data from 3,129 U.S. counties and county equivalents.
OR Value
(44.0%)
The regional value is compared to the Oregon State value.
US Value
(50.0%)
The regional value is compared to the national value.
Prior Value
(48.0%)
Prior Value compares a measured value with the previously measured value. Confidence intervals were not taken into account in determining the direction of the comparison.
Trend
This comparison measures the indicator’s values over multiple time periods.<br>The Mann-Kendall Test for Statistical Significance is used to evaluate the trend<br>over 4 to 10 periods of measure, subject to data availability and comparability.
Mental Health Provider Rate County: Clackamas
Mental Health Provider Rate County: Clackamas
398
Providers per 100,000 population
(2023)
Compared to:
OR Counties
The distribution is based on data from 35 Oregon counties.
U.S. Counties
The distribution is based on data from 2,956 U.S. counties and county equivalents.
OR Value
(677)
The regional value is compared to the Oregon State value.
Prior Value
(371)
Prior Value compares a measured value with the previously measured value. Confidence intervals were not taken into account in determining the direction of the comparison.
Trend
This comparison measures the indicator’s values over multiple time periods.<br>The Mann-Kendall Test for Statistical Significance is used to evaluate the trend<br>over 4 to 10 periods of measure, subject to data availability and comparability.
Non-Physician Primary Care Provider Rate County: Clackamas
Non-Physician Primary Care Provider Rate County: Clackamas
70
Providers per 100,000 population
(2023)
Compared to:
OR Counties
The distribution is based on data from 36 Oregon counties.
U.S. Counties
The distribution is based on data from 3,129 U.S. counties and county equivalents.
OR Value
(109)
The regional value is compared to the Oregon State value.
Prior Value
(66)
Prior Value compares a measured value with the previously measured value. Confidence intervals were not taken into account in determining the direction of the comparison.
Trend
This comparison measures the indicator’s values over multiple time periods.<br>The Mann-Kendall Test for Statistical Significance is used to evaluate the trend<br>over 4 to 10 periods of measure, subject to data availability and comparability.
Cervical Cancer Screening: 21-65 County: Clackamas
Cervical Cancer Screening: 21-65 County: Clackamas
84.9%
(2020)
Compared to:
OR Counties
The distribution is based on data from 36 Oregon counties.
U.S. Counties
The distribution is based on data from 3,141 U.S. counties and county equivalents.
US Value
(82.8%)
The regional value is compared to the national value.
Mothers who Received Early Prenatal Care County: Clackamas
Mothers who Received Early Prenatal Care County: Clackamas
83.9%
(2021)
Compared to:
OR Counties
The distribution is based on data from 36 Oregon counties.
OR Value
(82.0%)
The regional value is compared to the Oregon State value.
US Value
(78.3%)
The regional value is compared to the national value. The source for the national value is Centers for Disease Control and Prevention
Prior Value
(83.6%)
Prior Value compares a measured value with the previously measured value. Confidence intervals were not taken into account in determining the direction of the comparison.
Trend
This comparison measures the indicator’s values over multiple time periods.<br>The Mann-Kendall Test for Statistical Significance is used to evaluate the trend<br>over 4 to 10 periods of measure, subject to data availability and comparability.
Mothers who Received Adequate Prenatal Care: 5+ Visits County: Clackamas
Mothers who Received Adequate Prenatal Care: 5+ Visits County: Clackamas
95.4%
(2021)
Compared to:
OR Counties
The distribution is based on data from 36 Oregon counties.
OR Value
(94.2%)
The regional value is compared to the Oregon State value.
Prior Value
(93.9%)
Prior Value compares a measured value with the previously measured value. Confidence intervals were not taken into account in determining the direction of the comparison.
Trend
This comparison measures the indicator’s values over multiple time periods.<br>The Mann-Kendall Test for Statistical Significance is used to evaluate the trend<br>over 4 to 10 periods of measure, subject to data availability and comparability.
Primary Care Provider Rate County: Clackamas
Primary Care Provider Rate County: Clackamas
92
Providers per 100,000 population
(2021)
Compared to:
OR Counties
The distribution is based on data from 36 Oregon counties.
U.S. Counties
The distribution is based on data from 2,984 U.S. counties and county equivalents.
OR Value
(94)
The regional value is compared to the Oregon State value.
Prior Value
(90)
Prior Value compares a measured value with the previously measured value. Confidence intervals were not taken into account in determining the direction of the comparison.
Trend
This comparison measures the indicator’s values over multiple time periods.<br>The Mann-Kendall Test for Statistical Significance is used to evaluate the trend<br>over 4 to 10 periods of measure, subject to data availability and comparability.
Preventable Hospital Stays: Medicare Population County: Clackamas
Preventable Hospital Stays: Medicare Population County: Clackamas
1,787.0
Discharges per 100,000 Medicare enrollees
(2022)
Compared to:
OR Counties
The distribution is based on data from 36 Oregon counties.
U.S. Counties
The distribution is based on data from 3,129 U.S. counties and county equivalents.
OR Value
(1,812.0)
The regional value is compared to the Oregon State value.
US Value
(2,677.0)
The regional value is compared to the national value.
Prior Value
(1,768.0)
Prior Value compares a measured value with the previously measured value. Confidence intervals were not taken into account in determining the direction of the comparison.
Trend
This comparison measures the indicator’s values over multiple time periods.<br>The Mann-Kendall Test for Statistical Significance is used to evaluate the trend<br>over 4 to 10 periods of measure, subject to data availability and comparability.
Individual Behavior
Adults who Binge Drink County: Clackamas
Adults who Binge Drink County: Clackamas
17.1%
(2021)
Compared to:
OR Counties
The distribution is based on data from 36 Oregon counties.
U.S. Counties
The distribution is based on data from 3,074 U.S. counties and county equivalents.
US Value
(15.5%)
The regional value is compared to the national value.
Age-Adjusted Drug and Opioid-Involved Overdose Death Rate County: Clackamas
Age-Adjusted Drug and Opioid-Involved Overdose Death Rate County: Clackamas
11.1
Deaths per 100,000 population
(2018-2020)
Compared to:
U.S. Counties
The distribution is based on data from 1,303 U.S. counties and county equivalents.
OR Value
(15.1)
The regional value is compared to the Oregon State value.
US Value
(23.5)
The regional value is compared to the national value.
Prior Value
(10.3)
Prior Value compares a measured value with the previously measured value. Confidence intervals were taken into account in determining the direction of the comparison.
Hospital Admission Rate due to Drug Overdose County: Clackamas
Hospital Admission Rate due to Drug Overdose County: Clackamas
78.8
Admissions per 100,000 population
(2018)
Compared to:
OR Counties
The distribution is based on data from 30 Oregon counties.
OR Value
(97.0)
The regional value is compared to the Oregon State value.
Prior Value
(80.0)
Prior Value compares a measured value with the previously measured value. Confidence intervals were not taken into account in determining the direction of the comparison.
Trend
This comparison measures the indicator’s values over multiple time periods.<br>The Mann-Kendall Test for Statistical Significance is used to evaluate the trend<br>over 4 to 10 periods of measure, subject to data availability and comparability.
Adults 20+ who are Sedentary County: Clackamas
Adults 20+ who are Sedentary County: Clackamas
15.7%
(2021)
Compared to:
OR Counties
The distribution is based on data from 36 Oregon counties.
U.S. Counties
The distribution is based on data from 3,074 U.S. counties and county equivalents.
Prior Value
(14.8%)
Prior Value compares a measured value with the previously measured value. Confidence intervals were taken into account in determining the direction of the comparison.
Trend
This comparison measures the indicator’s values over multiple time periods.<br>The Mann-Kendall Test for Statistical Significance is used to evaluate the trend<br>over 4 to 10 periods of measure, subject to data availability and comparability.
Alcohol-Impaired Driving Deaths County: Clackamas
Alcohol-Impaired Driving Deaths County: Clackamas
32.8%
Percent of driving deaths with alcohol involvement
(2017-2021)
Compared to:
OR Counties
The distribution is based on data from 36 Oregon counties.
U.S. Counties
The distribution is based on data from 3,116 U.S. counties and county equivalents.
OR Value
(27.4%)
The regional value is compared to the Oregon State value.
US Value
(26.3%)
The regional value is compared to the national value.
Prior Value
(35.7%)
Prior Value compares a measured value with the previously measured value. Confidence intervals were taken into account in determining the direction of the comparison.
Trend
This comparison measures the indicator’s values over multiple time periods.<br>The Mann-Kendall Test for Statistical Significance is used to evaluate the trend<br>over 4 to 10 periods of measure, subject to data availability and comparability.
Students who Use Non-Cigarette Tobacco County: Clackamas
Students who Use Non-Cigarette Tobacco County: Clackamas
15.5%
(2022)
Compared to:
OR Counties
(2019)
The distribution is based on data from 28 Oregon counties.
OR Value
(13.8%)
The regional value is compared to the Oregon State value.
Prior Value
(12.4%)
Prior Value compares a measured value with the previously measured value. Confidence intervals were not taken into account in determining the direction of the comparison.
Trend
This comparison measures the indicator’s values over multiple time periods.<br>The Mann-Kendall Test for Statistical Significance is used to evaluate the trend<br>over 4 to 10 periods of measure, subject to data availability and comparability.
Teen Pregnancy Rate: 15-17-year-old County: Clackamas
Teen Pregnancy Rate: 15-17-year-old County: Clackamas
2.7
Pregnancies per 1,000 females aged 15-17
(2021)
Compared to:
OR Counties
The distribution is based on data from 28 Oregon counties.
OR Value
(5.8)
The regional value is compared to the Oregon State value.
Prior Value
(2.7)
Prior Value compares a measured value with the previously measured value. Confidence intervals were not taken into account in determining the direction of the comparison.
Trend
This comparison measures the indicator’s values over multiple time periods.<br>The Mann-Kendall Test for Statistical Significance is used to evaluate the trend<br>over 4 to 10 periods of measure, subject to data availability and comparability.
8th Grade Students Who Report Vaping or Using E-Cigarettes County: Clackamas
8th Grade Students Who Report Vaping or Using E-Cigarettes County: Clackamas
3.9%
(2022)
Compared to:
OR Counties
(2019)
The distribution is based on data from 28 Oregon counties.
OR Value
(4.7%)
The regional value is compared to the Oregon State value.
Prior Value
(3.5%)
Prior Value compares a measured value with the previously measured value. Confidence intervals were not taken into account in determining the direction of the comparison.
Trend
This comparison measures the indicator’s values over multiple time periods.<br>The Mann-Kendall Test for Statistical Significance is used to evaluate the trend<br>over 4 to 10 periods of measure, subject to data availability and comparability.
11th Grade Students Who Report Vaping or Using E-Cigarettes County: Clackamas
11th Grade Students Who Report Vaping or Using E-Cigarettes County: Clackamas
12.5%
(2022)
Compared to:
OR Counties
(2019)
The distribution is based on data from 28 Oregon counties.
OR Value
(10.8%)
The regional value is compared to the Oregon State value.
Prior Value
(7.6%)
Prior Value compares a measured value with the previously measured value. Confidence intervals were not taken into account in determining the direction of the comparison.
Trend
This comparison measures the indicator’s values over multiple time periods.<br>The Mann-Kendall Test for Statistical Significance is used to evaluate the trend<br>over 4 to 10 periods of measure, subject to data availability and comparability.
People 25+ with a High School Diploma or Higher County: Clackamas
People 25+ with a High School Diploma or Higher County: Clackamas
94.4%
(2018-2022)
Compared to:
OR Counties
The distribution is based on data from 36 Oregon counties.
U.S. Counties
The distribution is based on data from 3,133 U.S. counties and county equivalents.
OR Value
(91.6%)
The regional value is compared to the Oregon State value.
US Value
(89.1%)
The regional value is compared to the national value.
Trend
This comparison measures the indicator’s values over multiple time periods.<br>The Mann-Kendall Test for Statistical Significance is used to evaluate the trend<br>over 4 to 10 periods of measure, subject to data availability and comparability.
Social Environment
Substantiated Child Abuse Rate County: Clackamas
Substantiated Child Abuse Rate County: Clackamas
6.8
Cases per 1,000 children
(2022)
Compared to:
OR Counties
The distribution is based on data from 34 Oregon counties.
OR Value
(12.4)
The regional value is compared to the Oregon State value.
US Value
(7.7)
The regional value is compared to the national value. The source for the national value is Children's Bureau
Prior Value
(6.9)
Prior Value compares a measured value with the previously measured value. Confidence intervals were not taken into account in determining the direction of the comparison.
Trend
This comparison measures the indicator’s values over multiple time periods.<br>The Mann-Kendall Test for Statistical Significance is used to evaluate the trend<br>over 4 to 10 periods of measure, subject to data availability and comparability.
HP 2030 Target
(8.7)
Child Care Centers County: Clackamas
Child Care Centers County: Clackamas
7.1
Per 1,000 population under age 5
(2022)
Compared to:
OR Counties
The distribution is based on data from 36 Oregon counties.
OR Value
(8.5)
The regional value is compared to the Oregon State value.
US Value
(7.0)
The regional value is compared to the national value.
Prior Value
(3.3)
Prior Value compares a measured value with the previously measured value. Confidence intervals were not taken into account in determining the direction of the comparison.
Children in Single-Parent Households County: Clackamas
Children in Single-Parent Households County: Clackamas
15.9%
(2018-2022)
Compared to:
OR Counties
The distribution is based on data from 36 Oregon counties.
U.S. Counties
The distribution is based on data from 3,132 U.S. counties and county equivalents.
OR Value
(20.5%)
The regional value is compared to the Oregon State value.
US Value
(24.9%)
The regional value is compared to the national value.
Trend
This comparison measures the indicator’s values over multiple time periods.<br>The Mann-Kendall Test for Statistical Significance is used to evaluate the trend<br>over 4 to 10 periods of measure, subject to data availability and comparability.
Workers who Drive Alone to Work County: Clackamas
Workers who Drive Alone to Work County: Clackamas
70.3%
(2018-2022)
Compared to:
OR Counties
The distribution is based on data from 36 Oregon counties.
U.S. Counties
The distribution is based on data from 3,133 U.S. counties and county equivalents.
OR Value
(67.1%)
The regional value is compared to the Oregon State value.
US Value
(71.7%)
The regional value is compared to the national value.
Trend
This comparison measures the indicator’s values over multiple time periods.<br>The Mann-Kendall Test for Statistical Significance is used to evaluate the trend<br>over 4 to 10 periods of measure, subject to data availability and comparability.
Size of Labor Force County: Clackamas
Size of Labor Force County: Clackamas
224,206
Persons
(January 2024)
Compared to:
Prior Value
(224,071)
Prior Value compares a measured value with the previously measured value. Confidence intervals were not taken into account in determining the direction of the comparison.
Trend
This comparison measures the indicator’s values over multiple time periods.<br>The Mann-Kendall Test for Statistical Significance is used to evaluate the trend<br>over 4 to 10 periods of measure, subject to data availability and comparability.
Social Environment
Mortgaged Owners Spending 30% or More of Household Income on Housing
Value
Compared to:
Mortgaged Owners Spending 30% or More of Household Income on Housing County: Clackamas
Mortgaged Owners Spending 30% or More of Household Income on Housing County: Clackamas
31.6%
(2022)
Compared to:
U.S. Counties
The distribution is based on data from 828 U.S. counties and county equivalents.
OR Value
(31.8%)
The regional value is compared to the Oregon State value.
US Value
(27.8%)
The regional value is compared to the national value.
Prior Value
(31.1%)
Prior Value compares a measured value with the previously measured value. Confidence intervals were not taken into account in determining the direction of the comparison.
Trend
This comparison measures the indicator’s values over multiple time periods.<br>The Mann-Kendall Test for Statistical Significance is used to evaluate the trend<br>over 4 to 10 periods of measure, subject to data availability and comparability.
HP 2030 Target
(25.5%)
Renters Spending 30% or More of Household Income on Rent County: Clackamas
Renters Spending 30% or More of Household Income on Rent County: Clackamas
53.1%
(2018-2022)
Compared to:
OR Counties
The distribution is based on data from 36 Oregon counties.
U.S. Counties
The distribution is based on data from 3,132 U.S. counties and county equivalents.
OR Value
(50.9%)
The regional value is compared to the Oregon State value.
US Value
(49.9%)
The regional value is compared to the national value.
Trend
This comparison measures the indicator’s values over multiple time periods.<br>The Mann-Kendall Test for Statistical Significance is used to evaluate the trend<br>over 4 to 10 periods of measure, subject to data availability and comparability.
HP 2030 Target
(25.5%)
Income Inequality County: Clackamas
Income Inequality County: Clackamas
0.450
(2018-2022)
Compared to:
OR Counties
The distribution is based on data from 36 Oregon counties.
U.S. Counties
The distribution is based on data from 3,133 U.S. counties and county equivalents.
OR Value
(0.461)
The regional value is compared to the Oregon State value.
US Value
(0.483)
The regional value is compared to the national value.
Trend
This comparison measures the indicator’s values over multiple time periods.<br>The Mann-Kendall Test for Statistical Significance is used to evaluate the trend<br>over 4 to 10 periods of measure, subject to data availability and comparability.
3rd Grade Students Proficient in Reading County: Clackamas
3rd Grade Students Proficient in Reading County: Clackamas
53.8%
(2018-2019)
Compared to:
OR Counties
The distribution is based on data from 36 Oregon counties.
OR Value
(46.5%)
The regional value is compared to the Oregon State value.
Prior Value
(54.8%)
Prior Value compares a measured value with the previously measured value. Confidence intervals were not taken into account in determining the direction of the comparison.
8th Grade Students Proficient in Reading County: Clackamas
8th Grade Students Proficient in Reading County: Clackamas
58.0%
(2018-2019)
Compared to:

OR Counties
The distribution is based on data from 36 Oregon counties.
OR Value
(53.2%)
The regional value is compared to the Oregon State value.
Prior Value
(62.4%)
Prior Value compares a measured value with the previously measured value. Confidence intervals were not taken into account in determining the direction of the comparison.
Trend
This comparison measures the indicator’s values over multiple time periods.<br>The Mann-Kendall Test for Statistical Significance is used to evaluate the trend<br>over 4 to 10 periods of measure, subject to data availability and comparability.
People Living Below Poverty Level County: Clackamas
People Living Below Poverty Level County: Clackamas
7.6%
(2018-2022)
Compared to:
OR Counties
The distribution is based on data from 36 Oregon counties.
U.S. Counties
The distribution is based on data from 3,133 U.S. counties and county equivalents.
OR Value
(11.9%)
The regional value is compared to the Oregon State value.
US Value
(12.5%)
The regional value is compared to the national value.
Trend
This comparison measures the indicator’s values over multiple time periods.<br>The Mann-Kendall Test for Statistical Significance is used to evaluate the trend<br>over 4 to 10 periods of measure, subject to data availability and comparability.
HP 2030 Target
(8.0%)
Social Associations County: Clackamas
Social Associations County: Clackamas
8.5
Membership associations per 10,000 population
(2021)
Compared to:
OR Counties
The distribution is based on data from 36 Oregon counties.
U.S. Counties
The distribution is based on data from 3,141 U.S. counties and county equivalents.
OR Value
(9.8)
The regional value is compared to the Oregon State value.
US Value
(9.1)
The regional value is compared to the national value.
Prior Value
(8.7)
Prior Value compares a measured value with the previously measured value. Confidence intervals were not taken into account in determining the direction of the comparison.
Trend
This comparison measures the indicator’s values over multiple time periods.<br>The Mann-Kendall Test for Statistical Significance is used to evaluate the trend<br>over 4 to 10 periods of measure, subject to data availability and comparability.
Social and Economic Factors Ranking County: Clackamas
Social and Economic Factors Ranking County: Clackamas
3
(2023)
Compared to:
OR Counties
The distribution is based on data from 35 Oregon counties.
Age-Adjusted Death Rate due to Firearms County: Clackamas
Age-Adjusted Death Rate due to Firearms County: Clackamas
10.4
Deaths per 100,000 population
(2018-2020)
Compared to:
U.S. Counties
The distribution is based on data from 1,083 U.S. counties and county equivalents.
OR Value
(11.8)
The regional value is compared to the Oregon State value.
US Value
(12.0)
The regional value is compared to the national value.
Prior Value
(9.1)
Prior Value compares a measured value with the previously measured value. Confidence intervals were taken into account in determining the direction of the comparison.
Trend
This comparison measures the indicator’s values over multiple time periods.<br>The Mann-Kendall Test for Statistical Significance is used to evaluate the trend<br>over 4 to 10 periods of measure, subject to data availability and comparability.
HP 2030 Target
(10.7)
Voter Turnout: Presidential Election County: Clackamas
Voter Turnout: Presidential Election County: Clackamas
84.9%
(2020)
Compared to:
OR Counties
The distribution is based on data from 36 Oregon counties.
OR Value
(82.0%)
The regional value is compared to the Oregon State value.
Prior Value
(81.7%)
Prior Value compares a measured value with the previously measured value. Confidence intervals were not taken into account in determining the direction of the comparison.
Trend
This comparison measures the indicator’s values over multiple time periods.<br>The Mann-Kendall Test for Statistical Significance is used to evaluate the trend<br>over 4 to 10 periods of measure, subject to data availability and comparability.
HP 2030 Target
(58.4%)
<div>SDOH-07: Increase the proportion of the voting-age citizens who vote</div>
Physical Environment
Access to Exercise Opportunities County: Clackamas
Access to Exercise Opportunities County: Clackamas
91.8%
(2024)
Compared to:
OR Counties
The distribution is based on data from 36 Oregon counties.
U.S. Counties
The distribution is based on data from 3,096 U.S. counties and county equivalents.
OR Value
(87.7%)
The regional value is compared to the Oregon State value.
US Value
(84.1%)
The regional value is compared to the national value.
Prior Value
(91.8%)
Prior Value compares a measured value with the previously measured value. Confidence intervals were not taken into account in determining the direction of the comparison.
Access to Parks County: Clackamas
Access to Parks County: Clackamas
83.2%
(2020)
Compared to:
OR Counties
The distribution is based on data from 36 Oregon counties.
OR Value
(90.4%)
The regional value is compared to the Oregon State value.
Prior Value
(79.3%)
Prior Value compares a measured value with the previously measured value. Confidence intervals were not taken into account in determining the direction of the comparison.
Food Environment Index County: Clackamas
Food Environment Index County: Clackamas
9.0
(2024)
Compared to:
OR Counties
The distribution is based on data from 36 Oregon counties.
U.S. Counties
The distribution is based on data from 3,108 U.S. counties and county equivalents.
OR Value
(8.1)
The regional value is compared to the Oregon State value.
US Value
(7.7)
The regional value is compared to the national value.
Prior Value
(8.8)
Prior Value compares a measured value with the previously measured value. Confidence intervals were not taken into account in determining the direction of the comparison.
Trend
This comparison measures the indicator’s values over multiple time periods.<br>The Mann-Kendall Test for Statistical Significance is used to evaluate the trend<br>over 4 to 10 periods of measure, subject to data availability and comparability.
Workers Commuting by Public Transportation County: Clackamas
Workers Commuting by Public Transportation County: Clackamas
2.1%
(2018-2022)
Compared to:
OR Counties
The distribution is based on data from 36 Oregon counties.
U.S. Counties
(2015-2019)
The distribution is based on data from 3,142 U.S. counties and county equivalents.
OR Value
(3.0%)
The regional value is compared to the Oregon State value.
US Value
(3.8%)
The regional value is compared to the national value.
Trend
This comparison measures the indicator’s values over multiple time periods.<br>The Mann-Kendall Test for Statistical Significance is used to evaluate the trend<br>over 4 to 10 periods of measure, subject to data availability and comparability.
HP 2030 Target
(5.3%)
Annual Ozone Air Quality County: Clackamas
Annual Ozone Air Quality County: Clackamas
3
(2019-2021)
Compared to:
Air Quality Index
The American Lung Association (ALA) assigns grades A-F to counties (A=1; B=2; C=3; D=4; F=5), based on average annual number of days that ozone levels exceeded U.S. standards during the three year measurement period. The five-point grading scale was used for the distribution (Green = <2; Yellow = 2 - 3; Red = >3). The air quality data is collected by the EPA and summarized by the ALA.
Prior Value
(4)
Prior Value compares a measured value with the previously measured value. Confidence intervals were not taken into account in determining the direction of the comparison.
Trend
This comparison measures the indicator’s values over multiple time periods.<br>The Mann-Kendall Test for Statistical Significance is used to evaluate the trend<br>over 4 to 10 periods of measure, subject to data availability and comparability.
Number of Extreme Heat Days County: Clackamas
Number of Extreme Heat Days County: Clackamas
31
Days
(2021)
Compared to:
Prior Value
(15)
Prior Value compares a measured value with the previously measured value. Confidence intervals were not taken into account in determining the direction of the comparison.
Trend
This comparison measures the indicator’s values over multiple time periods.<br>The Mann-Kendall Test for Statistical Significance is used to evaluate the trend<br>over 4 to 10 periods of measure, subject to data availability and comparability.
Number of Extreme Heat Events County: Clackamas
Number of Extreme Heat Events County: Clackamas
28
Events
(2021)
Compared to:
Prior Value
(11)
Prior Value compares a measured value with the previously measured value. Confidence intervals were not taken into account in determining the direction of the comparison.
Trend
This comparison measures the indicator’s values over multiple time periods.<br>The Mann-Kendall Test for Statistical Significance is used to evaluate the trend<br>over 4 to 10 periods of measure, subject to data availability and comparability.
Number of Extreme Precipitation Days County: Clackamas
Number of Extreme Precipitation Days County: Clackamas
29
Days
(2021)
Compared to:
Prior Value
(30)
Prior Value compares a measured value with the previously measured value. Confidence intervals were not taken into account in determining the direction of the comparison.
Trend
This comparison measures the indicator’s values over multiple time periods.<br>The Mann-Kendall Test for Statistical Significance is used to evaluate the trend<br>over 4 to 10 periods of measure, subject to data availability and comparability.
Weeks of Moderate Drought or Worse County: Clackamas
Weeks of Moderate Drought or Worse County: Clackamas
30
Weeks per year
(2021)
Compared to:
Prior Value
(42)
Prior Value compares a measured value with the previously measured value. Confidence intervals were not taken into account in determining the direction of the comparison.
Trend
This comparison measures the indicator’s values over multiple time periods.<br>The Mann-Kendall Test for Statistical Significance is used to evaluate the trend<br>over 4 to 10 periods of measure, subject to data availability and comparability.
Severe Housing Problems County: Clackamas
Severe Housing Problems County: Clackamas
16.4%
(2016-2020)
Compared to:
OR Counties
The distribution is based on data from 36 Oregon counties.
U.S. Counties
The distribution is based on data from 3,141 U.S. counties and county equivalents.
OR Value
(18.0%)
The regional value is compared to the Oregon State value.
US Value
(16.7%)
The regional value is compared to the national value.
Prior Value
(16.5%)
Prior Value compares a measured value with the previously measured value. Confidence intervals were taken into account in determining the direction of the comparison.
Trend
This comparison measures the indicator’s values over multiple time periods.<br>The Mann-Kendall Test for Statistical Significance is used to evaluate the trend<br>over 4 to 10 periods of measure, subject to data availability and comparability.
Overcrowded Households County: Clackamas
Overcrowded Households County: Clackamas
2.3%
(2018-2022)
Compared to:
OR Counties
The distribution is based on data from 36 Oregon counties.
OR Value
(3.2%)
The regional value is compared to the Oregon State value.
US Value
(3.4%)
The regional value is compared to the national value.
Trend
This comparison measures the indicator’s values over multiple time periods.<br>The Mann-Kendall Test for Statistical Significance is used to evaluate the trend<br>over 4 to 10 periods of measure, subject to data availability and comparability.
Liquor Store Density County: Clackamas
Liquor Store Density County: Clackamas
4.3
Stores per 100,000 population
(2021)
Compared to:
OR Counties
The distribution is based on data from 21 Oregon counties.
U.S. Counties
The distribution is based on data from 1,477 U.S. counties and county equivalents.
OR Value
(5.7)
The regional value is compared to the Oregon State value.
US Value
(10.7)
The regional value is compared to the national value.
Prior Value
(4.7)
Prior Value compares a measured value with the previously measured value. Confidence intervals were not taken into account in determining the direction of the comparison.
Trend
This comparison measures the indicator’s values over multiple time periods.<br>The Mann-Kendall Test for Statistical Significance is used to evaluate the trend<br>over 4 to 10 periods of measure, subject to data availability and comparability.
